Rhodococcus sp. S2-17
Taxonomy: cellular organisms; Bacteria; Terrabacteria group; Actinobacteria; Actinomycetia; Corynebacteriales; Nocardiaceae; Rhodococcus; unclassified Rhodococcus
Average proteome isoelectric point is 5.93
Get precalculated fractions of proteins
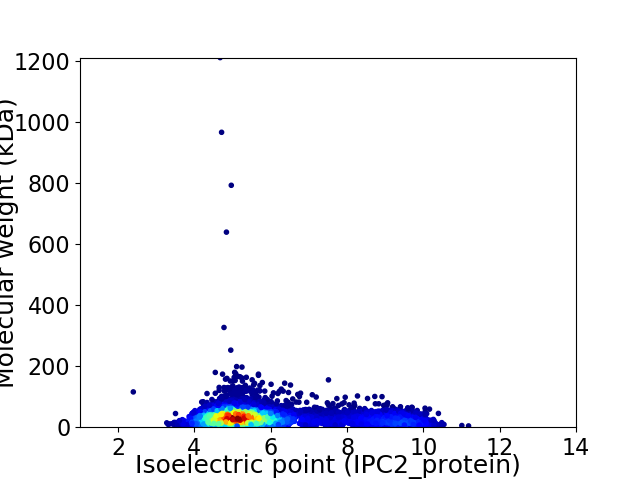
Virtual 2D-PAGE plot for 6874 proteins (isoelectric point calculated using IPC2_protein)
Get csv file with sequences according to given criteria:
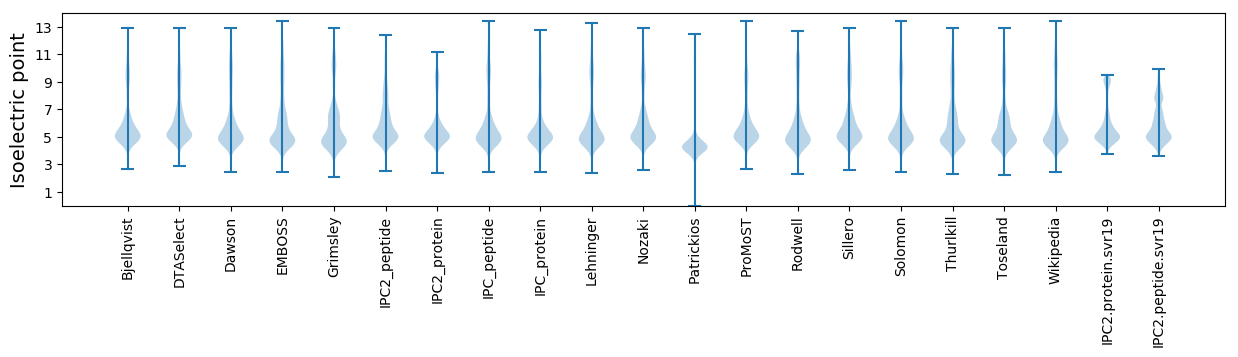
* You can choose from 21 different methods for calculating isoelectric point
Summary statistics related to proteome-wise predictions
Protein with the lowest isoelectric point:
>tr|A0A2S2C5L2|A0A2S2C5L2_9NOCA Uncharacterized protein OS=Rhodococcus sp. S2-17 OX=1990687 GN=CBI38_32340 PE=4 SV=1
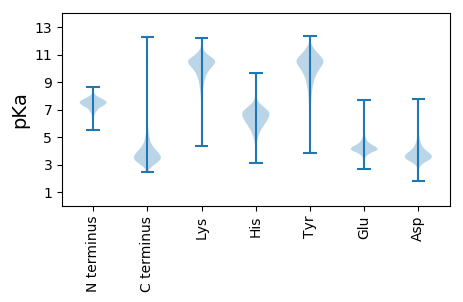
MM1 pKa = 7.4AVVKK5 pKa = 10.63ANLGACQGYY14 pKa = 10.24ANCVVAADD22 pKa = 4.88DD23 pKa = 4.68YY24 pKa = 11.91FDD26 pKa = 5.01IDD28 pKa = 3.94DD29 pKa = 4.94DD30 pKa = 4.74GVVEE34 pKa = 4.16LLSVEE39 pKa = 4.28VPEE42 pKa = 4.39SEE44 pKa = 4.3RR45 pKa = 11.84GRR47 pKa = 11.84VDD49 pKa = 3.01SAARR53 pKa = 11.84SCPVSALWIEE63 pKa = 4.39DD64 pKa = 3.3
MM1 pKa = 7.4AVVKK5 pKa = 10.63ANLGACQGYY14 pKa = 10.24ANCVVAADD22 pKa = 4.88DD23 pKa = 4.68YY24 pKa = 11.91FDD26 pKa = 5.01IDD28 pKa = 3.94DD29 pKa = 4.94DD30 pKa = 4.74GVVEE34 pKa = 4.16LLSVEE39 pKa = 4.28VPEE42 pKa = 4.39SEE44 pKa = 4.3RR45 pKa = 11.84GRR47 pKa = 11.84VDD49 pKa = 3.01SAARR53 pKa = 11.84SCPVSALWIEE63 pKa = 4.39DD64 pKa = 3.3
Molecular weight: 6.81 kDa
Isoelectric point according different methods:
Protein with the highest isoelectric point:
>tr|A0A2S2BSA5|A0A2S2BSA5_9NOCA Glycosyl transferase OS=Rhodococcus sp. S2-17 OX=1990687 GN=CBI38_07565 PE=4 SV=1
MM1 pKa = 7.4GSVIKK6 pKa = 10.38KK7 pKa = 8.42RR8 pKa = 11.84RR9 pKa = 11.84KK10 pKa = 9.06RR11 pKa = 11.84MSKK14 pKa = 9.76KK15 pKa = 9.54KK16 pKa = 9.72HH17 pKa = 5.63RR18 pKa = 11.84KK19 pKa = 7.56LLRR22 pKa = 11.84RR23 pKa = 11.84TRR25 pKa = 11.84VQRR28 pKa = 11.84RR29 pKa = 11.84KK30 pKa = 10.11LGKK33 pKa = 9.87
MM1 pKa = 7.4GSVIKK6 pKa = 10.38KK7 pKa = 8.42RR8 pKa = 11.84RR9 pKa = 11.84KK10 pKa = 9.06RR11 pKa = 11.84MSKK14 pKa = 9.76KK15 pKa = 9.54KK16 pKa = 9.72HH17 pKa = 5.63RR18 pKa = 11.84KK19 pKa = 7.56LLRR22 pKa = 11.84RR23 pKa = 11.84TRR25 pKa = 11.84VQRR28 pKa = 11.84RR29 pKa = 11.84KK30 pKa = 10.11LGKK33 pKa = 9.87
Molecular weight: 4.15 kDa
Isoelectric point according different methods:
Peptides (in silico digests for buttom-up proteomics)
Below you can find in silico digests of the whole proteome with Trypsin, Chymotrypsin, Trypsin+LysC, LysN, ArgC proteases suitable for different mass spec machines.| Try ESI |
 |
|---|
| ChTry ESI |
|
|---|
| ArgC ESI |
|
|---|
| LysN ESI |
|
|---|
| TryLysC ESI |
|
|---|
| Try MALDI |
|
|---|
| ChTry MALDI |
|
|---|
| ArgC MALDI |
|
|---|
| LysN MALDI |
|
|---|
| TryLysC MALDI |
|
|---|
| Try LTQ |
|
|---|
| ChTry LTQ |
|
|---|
| ArgC LTQ |
|
|---|
| LysN LTQ |
|
|---|
| TryLysC LTQ |
|
|---|
| Try MSlow |
|
|---|
| ChTry MSlow |
|
|---|
| ArgC MSlow |
|
|---|
| LysN MSlow |
|
|---|
| TryLysC MSlow |
|
|---|
| Try MShigh |
|
|---|
| ChTry MShigh |
|
|---|
| ArgC MShigh |
|
|---|
| LysN MShigh |
|
|---|
| TryLysC MShigh |
|
|---|
General Statistics
Number of major isoforms |
Number of additional isoforms |
Number of all proteins |
Number of amino acids |
Min. Seq. Length |
Max. Seq. Length |
Avg. Seq. Length |
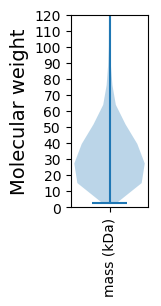
Avg. Mol. Weight |
|---|---|---|---|---|---|---|---|
0 |
2188525 |
24 |
11272 |
318.4 |
34.19 |
Amino acid frequency
Ala |
Cys |
Asp |
Glu |
Phe |
Gly |
His |
Ile |
Lys |
Leu |
|---|---|---|---|---|---|---|---|---|---|
12.492 ± 0.04 | 0.816 ± 0.008 |
6.277 ± 0.023 | 5.654 ± 0.027 |
3.033 ± 0.018 | 8.892 ± 0.03 |
2.266 ± 0.015 | 4.277 ± 0.02 |
2.18 ± 0.024 | 9.937 ± 0.033 |
Met |
Asn |
Gln |
Pro |
Arg |
Ser |
Thr |
Val |
Trp |
Tyr |
|---|---|---|---|---|---|---|---|---|---|
1.973 ± 0.012 | 2.113 ± 0.015 |
5.559 ± 0.023 | 2.836 ± 0.016 |
7.279 ± 0.027 | 5.832 ± 0.022 |
6.296 ± 0.019 | 8.823 ± 0.027 |
1.429 ± 0.013 | 2.037 ± 0.015 |
Most of the basic statistics you can see at this page can be downloaded from this CSV file
See this proteome in:

Proteome-pI is available under Creative Commons Attribution-NoDerivs license, for more details see here
| Reference: Kozlowski LP. Proteome-pI 2.0: Proteome Isoelectric Point Database Update. Nucleic Acids Res. 2021, doi: 10.1093/nar/gkab944 | Contact: Lukasz P. Kozlowski |