Frisingicoccus caecimuris
Taxonomy: cellular organisms; Bacteria; Terrabacteria group; Firmicutes; Clostridia; Eubacteriales; Lachnospiraceae; Frisingicoccus
Average proteome isoelectric point is 6.08
Get precalculated fractions of proteins
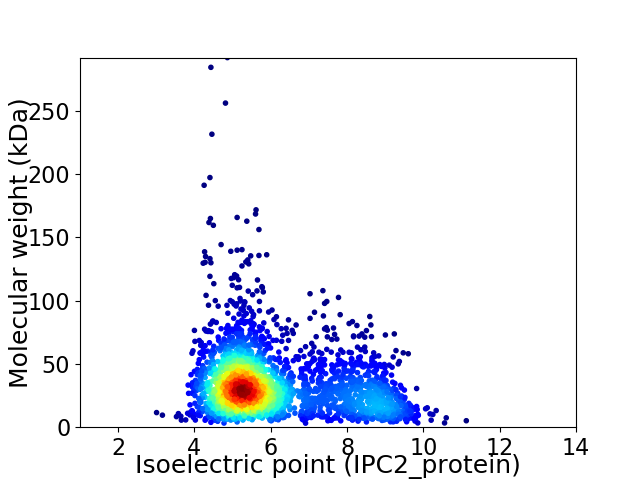
Virtual 2D-PAGE plot for 2610 proteins (isoelectric point calculated using IPC2_protein)
Get csv file with sequences according to given criteria:
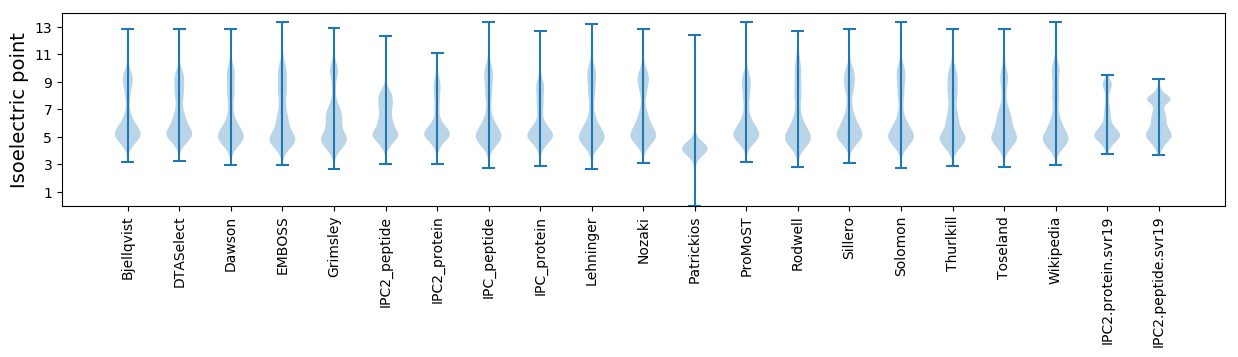
* You can choose from 21 different methods for calculating isoelectric point
Summary statistics related to proteome-wise predictions
Protein with the lowest isoelectric point:
>tr|A0A4R2LFZ6|A0A4R2LFZ6_9FIRM Amino acid ABC transporter ATP-binding protein (PAAT family) OS=Frisingicoccus caecimuris OX=1796636 GN=EV212_1043 PE=4 SV=1
MM1 pKa = 7.31TVQDD5 pKa = 5.54LINTNLFQLINAGDD19 pKa = 4.09DD20 pKa = 3.56LNRR23 pKa = 11.84DD24 pKa = 2.81ITGPFCCDD32 pKa = 3.4LLSIAMGKK40 pKa = 10.01APAGCAWVTVMSNINTLAVASLTDD64 pKa = 3.42TACIILAEE72 pKa = 4.31DD73 pKa = 3.68TSVDD77 pKa = 3.61EE78 pKa = 4.33VTLAKK83 pKa = 10.7AKK85 pKa = 9.34MQGITLFTTGLPVFNAALSIYY106 pKa = 9.68QQLNPP111 pKa = 4.27
MM1 pKa = 7.31TVQDD5 pKa = 5.54LINTNLFQLINAGDD19 pKa = 4.09DD20 pKa = 3.56LNRR23 pKa = 11.84DD24 pKa = 2.81ITGPFCCDD32 pKa = 3.4LLSIAMGKK40 pKa = 10.01APAGCAWVTVMSNINTLAVASLTDD64 pKa = 3.42TACIILAEE72 pKa = 4.31DD73 pKa = 3.68TSVDD77 pKa = 3.61EE78 pKa = 4.33VTLAKK83 pKa = 10.7AKK85 pKa = 9.34MQGITLFTTGLPVFNAALSIYY106 pKa = 9.68QQLNPP111 pKa = 4.27
Molecular weight: 11.77 kDa
Isoelectric point according different methods:
Protein with the highest isoelectric point:
>tr|A0A4R2LP30|A0A4R2LP30_9FIRM Branched-chain-amino-acid transaminase OS=Frisingicoccus caecimuris OX=1796636 GN=EV212_103254 PE=3 SV=1
MM1 pKa = 7.67KK2 pKa = 8.72MTFQPKK8 pKa = 8.95KK9 pKa = 7.58RR10 pKa = 11.84QRR12 pKa = 11.84SKK14 pKa = 9.07VHH16 pKa = 5.95GFRR19 pKa = 11.84KK20 pKa = 10.0RR21 pKa = 11.84MSTANGRR28 pKa = 11.84KK29 pKa = 8.89VLAARR34 pKa = 11.84RR35 pKa = 11.84AKK37 pKa = 10.2GRR39 pKa = 11.84NKK41 pKa = 10.44LSAA44 pKa = 3.84
MM1 pKa = 7.67KK2 pKa = 8.72MTFQPKK8 pKa = 8.95KK9 pKa = 7.58RR10 pKa = 11.84QRR12 pKa = 11.84SKK14 pKa = 9.07VHH16 pKa = 5.95GFRR19 pKa = 11.84KK20 pKa = 10.0RR21 pKa = 11.84MSTANGRR28 pKa = 11.84KK29 pKa = 8.89VLAARR34 pKa = 11.84RR35 pKa = 11.84AKK37 pKa = 10.2GRR39 pKa = 11.84NKK41 pKa = 10.44LSAA44 pKa = 3.84
Molecular weight: 5.11 kDa
Isoelectric point according different methods:
Peptides (in silico digests for buttom-up proteomics)
Below you can find in silico digests of the whole proteome with Trypsin, Chymotrypsin, Trypsin+LysC, LysN, ArgC proteases suitable for different mass spec machines.| Try ESI |
 |
|---|
| ChTry ESI |
|
|---|
| ArgC ESI |
|
|---|
| LysN ESI |
|
|---|
| TryLysC ESI |
|
|---|
| Try MALDI |
|
|---|
| ChTry MALDI |
|
|---|
| ArgC MALDI |
|
|---|
| LysN MALDI |
|
|---|
| TryLysC MALDI |
|
|---|
| Try LTQ |
|
|---|
| ChTry LTQ |
|
|---|
| ArgC LTQ |
|
|---|
| LysN LTQ |
|
|---|
| TryLysC LTQ |
|
|---|
| Try MSlow |
|
|---|
| ChTry MSlow |
|
|---|
| ArgC MSlow |
|
|---|
| LysN MSlow |
|
|---|
| TryLysC MSlow |
|
|---|
| Try MShigh |
|
|---|
| ChTry MShigh |
|
|---|
| ArgC MShigh |
|
|---|
| LysN MShigh |
|
|---|
| TryLysC MShigh |
|
|---|
General Statistics
Number of major isoforms |
Number of additional isoforms |
Number of all proteins |
Number of amino acids |
Min. Seq. Length |
Max. Seq. Length |
Avg. Seq. Length |
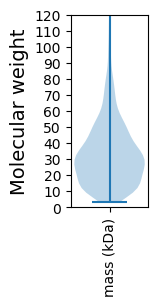
Avg. Mol. Weight |
|---|---|---|---|---|---|---|---|
0 |
818533 |
30 |
2584 |
313.6 |
35.19 |
Amino acid frequency
Ala |
Cys |
Asp |
Glu |
Phe |
Gly |
His |
Ile |
Lys |
Leu |
|---|---|---|---|---|---|---|---|---|---|
7.433 ± 0.054 | 1.48 ± 0.019 |
5.702 ± 0.036 | 7.721 ± 0.054 |
4.008 ± 0.029 | 7.22 ± 0.046 |
1.797 ± 0.022 | 7.531 ± 0.044 |
6.615 ± 0.046 | 8.783 ± 0.046 |
Met |
Asn |
Gln |
Pro |
Arg |
Ser |
Thr |
Val |
Trp |
Tyr |
|---|---|---|---|---|---|---|---|---|---|
3.319 ± 0.026 | 4.235 ± 0.031 |
3.334 ± 0.027 | 3.223 ± 0.025 |
4.729 ± 0.045 | 5.666 ± 0.032 |
5.29 ± 0.04 | 6.985 ± 0.039 |
0.89 ± 0.016 | 4.037 ± 0.03 |
Most of the basic statistics you can see at this page can be downloaded from this CSV file
See this proteome in:

Proteome-pI is available under Creative Commons Attribution-NoDerivs license, for more details see here
| Reference: Kozlowski LP. Proteome-pI 2.0: Proteome Isoelectric Point Database Update. Nucleic Acids Res. 2021, doi: 10.1093/nar/gkab944 | Contact: Lukasz P. Kozlowski |