Algibacter aquaticus
Taxonomy: cellular organisms; Bacteria; FCB group; Bacteroidetes/Chlorobi group; Bacteroidetes; Flavobacteriia; Flavobacteriales;
Average proteome isoelectric point is 6.93
Get precalculated fractions of proteins
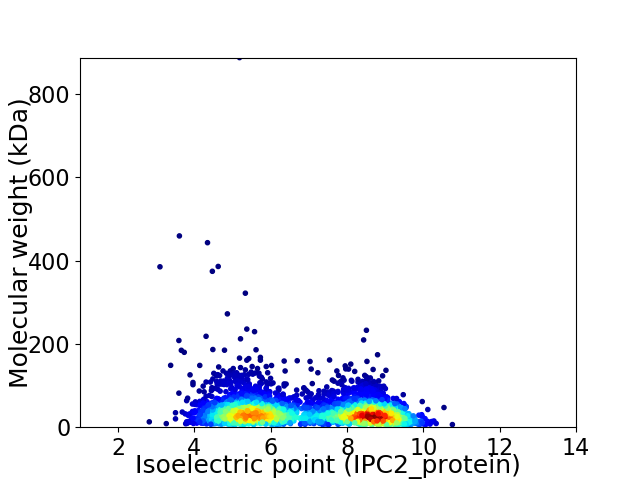
Virtual 2D-PAGE plot for 3717 proteins (isoelectric point calculated using IPC2_protein)
Get csv file with sequences according to given criteria:
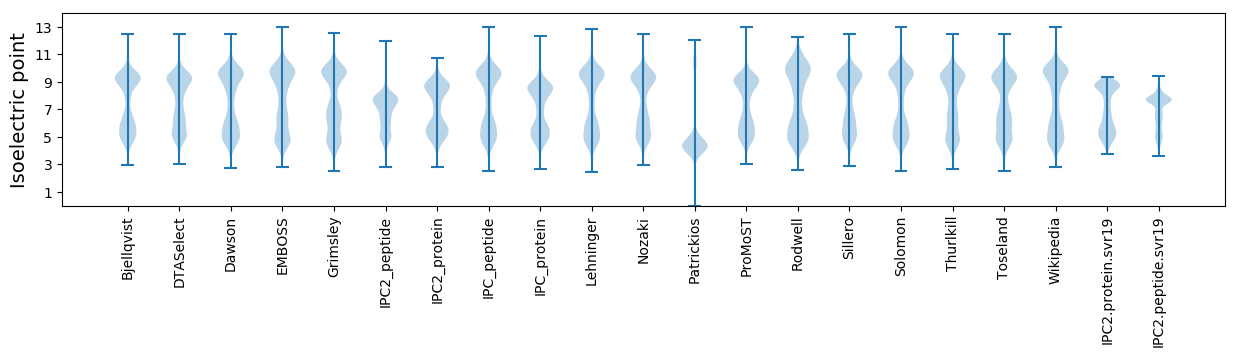
* You can choose from 21 different methods for calculating isoelectric point
Summary statistics related to proteome-wise predictions
Protein with the lowest isoelectric point:
>tr|A0A1E5T9B1|A0A1E5T9B1_9FLAO Uncharacterized protein OS=Algibacter aquaticus OX=1849968 GN=A8C32_15750 PE=4 SV=1
MM1 pKa = 7.72KK2 pKa = 9.27NTNSLNLIICTILFTAFLSCNNDD25 pKa = 3.1DD26 pKa = 5.0DD27 pKa = 5.64APSSTIDD34 pKa = 3.48QISDD38 pKa = 2.82IAEE41 pKa = 4.19FYY43 pKa = 11.49GNLEE47 pKa = 3.57GDD49 pKa = 3.35IVVIHH54 pKa = 5.7SQGGSGLEE62 pKa = 3.94LDD64 pKa = 4.86DD65 pKa = 6.28AEE67 pKa = 4.48TSNQIVAEE75 pKa = 4.24LGIQSAMYY83 pKa = 10.85VMVHH87 pKa = 5.17QVQTKK92 pKa = 8.63TPMLFTDD99 pKa = 3.39SDD101 pKa = 3.7ITFEE105 pKa = 4.24QAKK108 pKa = 9.63EE109 pKa = 3.87YY110 pKa = 10.94NLQSVSNIKK119 pKa = 10.26RR120 pKa = 11.84VVDD123 pKa = 4.17FFNNQQGKK131 pKa = 6.13TVYY134 pKa = 10.72LLGISYY140 pKa = 10.61GCLIVQEE147 pKa = 5.21LIATYY152 pKa = 10.28GVDD155 pKa = 3.29VADD158 pKa = 5.17GYY160 pKa = 11.46LILGNRR166 pKa = 11.84LDD168 pKa = 3.99MDD170 pKa = 4.16DD171 pKa = 5.11AAWQALSEE179 pKa = 4.65GNFPYY184 pKa = 9.52YY185 pKa = 10.54TYY187 pKa = 11.32DD188 pKa = 3.06NDD190 pKa = 3.61GNYY193 pKa = 9.74TIEE196 pKa = 4.16VEE198 pKa = 4.13NDD200 pKa = 3.16PEE202 pKa = 3.82FDD204 pKa = 3.73IIEE207 pKa = 4.23EE208 pKa = 4.17RR209 pKa = 11.84NMGRR213 pKa = 11.84LLAGLAFNRR222 pKa = 11.84YY223 pKa = 7.09TDD225 pKa = 3.38RR226 pKa = 11.84LSNVSSLSKK235 pKa = 9.27VTYY238 pKa = 10.36VYY240 pKa = 11.21GDD242 pKa = 3.55RR243 pKa = 11.84DD244 pKa = 3.72EE245 pKa = 4.6VAGPLSAQEE254 pKa = 3.88IQFLNDD260 pKa = 2.71KK261 pKa = 9.08GANVILSEE269 pKa = 4.73GSGHH273 pKa = 7.49DD274 pKa = 3.64DD275 pKa = 5.08AIGEE279 pKa = 4.39GAGLLKK285 pKa = 10.53EE286 pKa = 4.35VFGIEE291 pKa = 3.84
MM1 pKa = 7.72KK2 pKa = 9.27NTNSLNLIICTILFTAFLSCNNDD25 pKa = 3.1DD26 pKa = 5.0DD27 pKa = 5.64APSSTIDD34 pKa = 3.48QISDD38 pKa = 2.82IAEE41 pKa = 4.19FYY43 pKa = 11.49GNLEE47 pKa = 3.57GDD49 pKa = 3.35IVVIHH54 pKa = 5.7SQGGSGLEE62 pKa = 3.94LDD64 pKa = 4.86DD65 pKa = 6.28AEE67 pKa = 4.48TSNQIVAEE75 pKa = 4.24LGIQSAMYY83 pKa = 10.85VMVHH87 pKa = 5.17QVQTKK92 pKa = 8.63TPMLFTDD99 pKa = 3.39SDD101 pKa = 3.7ITFEE105 pKa = 4.24QAKK108 pKa = 9.63EE109 pKa = 3.87YY110 pKa = 10.94NLQSVSNIKK119 pKa = 10.26RR120 pKa = 11.84VVDD123 pKa = 4.17FFNNQQGKK131 pKa = 6.13TVYY134 pKa = 10.72LLGISYY140 pKa = 10.61GCLIVQEE147 pKa = 5.21LIATYY152 pKa = 10.28GVDD155 pKa = 3.29VADD158 pKa = 5.17GYY160 pKa = 11.46LILGNRR166 pKa = 11.84LDD168 pKa = 3.99MDD170 pKa = 4.16DD171 pKa = 5.11AAWQALSEE179 pKa = 4.65GNFPYY184 pKa = 9.52YY185 pKa = 10.54TYY187 pKa = 11.32DD188 pKa = 3.06NDD190 pKa = 3.61GNYY193 pKa = 9.74TIEE196 pKa = 4.16VEE198 pKa = 4.13NDD200 pKa = 3.16PEE202 pKa = 3.82FDD204 pKa = 3.73IIEE207 pKa = 4.23EE208 pKa = 4.17RR209 pKa = 11.84NMGRR213 pKa = 11.84LLAGLAFNRR222 pKa = 11.84YY223 pKa = 7.09TDD225 pKa = 3.38RR226 pKa = 11.84LSNVSSLSKK235 pKa = 9.27VTYY238 pKa = 10.36VYY240 pKa = 11.21GDD242 pKa = 3.55RR243 pKa = 11.84DD244 pKa = 3.72EE245 pKa = 4.6VAGPLSAQEE254 pKa = 3.88IQFLNDD260 pKa = 2.71KK261 pKa = 9.08GANVILSEE269 pKa = 4.73GSGHH273 pKa = 7.49DD274 pKa = 3.64DD275 pKa = 5.08AIGEE279 pKa = 4.39GAGLLKK285 pKa = 10.53EE286 pKa = 4.35VFGIEE291 pKa = 3.84
Molecular weight: 32.01 kDa
Isoelectric point according different methods:
Protein with the highest isoelectric point:
>tr|A0A1E5T8X8|A0A1E5T8X8_9FLAO Lipoprotein signal peptidase OS=Algibacter aquaticus OX=1849968 GN=lspA PE=3 SV=1
MM1 pKa = 7.69SKK3 pKa = 9.01RR4 pKa = 11.84TFQPSKK10 pKa = 9.13RR11 pKa = 11.84KK12 pKa = 9.48RR13 pKa = 11.84RR14 pKa = 11.84NKK16 pKa = 9.49HH17 pKa = 3.94GFRR20 pKa = 11.84EE21 pKa = 4.27RR22 pKa = 11.84MASANGRR29 pKa = 11.84KK30 pKa = 9.04VLARR34 pKa = 11.84RR35 pKa = 11.84RR36 pKa = 11.84AKK38 pKa = 10.09GRR40 pKa = 11.84KK41 pKa = 7.97KK42 pKa = 10.62LSVSSEE48 pKa = 4.03TRR50 pKa = 11.84HH51 pKa = 5.96KK52 pKa = 10.68KK53 pKa = 9.8
MM1 pKa = 7.69SKK3 pKa = 9.01RR4 pKa = 11.84TFQPSKK10 pKa = 9.13RR11 pKa = 11.84KK12 pKa = 9.48RR13 pKa = 11.84RR14 pKa = 11.84NKK16 pKa = 9.49HH17 pKa = 3.94GFRR20 pKa = 11.84EE21 pKa = 4.27RR22 pKa = 11.84MASANGRR29 pKa = 11.84KK30 pKa = 9.04VLARR34 pKa = 11.84RR35 pKa = 11.84RR36 pKa = 11.84AKK38 pKa = 10.09GRR40 pKa = 11.84KK41 pKa = 7.97KK42 pKa = 10.62LSVSSEE48 pKa = 4.03TRR50 pKa = 11.84HH51 pKa = 5.96KK52 pKa = 10.68KK53 pKa = 9.8
Molecular weight: 6.32 kDa
Isoelectric point according different methods:
Peptides (in silico digests for buttom-up proteomics)
Below you can find in silico digests of the whole proteome with Trypsin, Chymotrypsin, Trypsin+LysC, LysN, ArgC proteases suitable for different mass spec machines.| Try ESI |
 |
|---|
| ChTry ESI |
|
|---|
| ArgC ESI |
|
|---|
| LysN ESI |
|
|---|
| TryLysC ESI |
|
|---|
| Try MALDI |
|
|---|
| ChTry MALDI |
|
|---|
| ArgC MALDI |
|
|---|
| LysN MALDI |
|
|---|
| TryLysC MALDI |
|
|---|
| Try LTQ |
|
|---|
| ChTry LTQ |
|
|---|
| ArgC LTQ |
|
|---|
| LysN LTQ |
|
|---|
| TryLysC LTQ |
|
|---|
| Try MSlow |
|
|---|
| ChTry MSlow |
|
|---|
| ArgC MSlow |
|
|---|
| LysN MSlow |
|
|---|
| TryLysC MSlow |
|
|---|
| Try MShigh |
|
|---|
| ChTry MShigh |
|
|---|
| ArgC MShigh |
|
|---|
| LysN MShigh |
|
|---|
| TryLysC MShigh |
|
|---|
General Statistics
Number of major isoforms |
Number of additional isoforms |
Number of all proteins |
Number of amino acids |
Min. Seq. Length |
Max. Seq. Length |
Avg. Seq. Length |
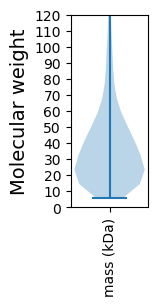
Avg. Mol. Weight |
|---|---|---|---|---|---|---|---|
0 |
1300701 |
50 |
7978 |
349.9 |
39.6 |
Amino acid frequency
Ala |
Cys |
Asp |
Glu |
Phe |
Gly |
His |
Ile |
Lys |
Leu |
|---|---|---|---|---|---|---|---|---|---|
5.721 ± 0.033 | 0.772 ± 0.014 |
5.533 ± 0.036 | 6.327 ± 0.04 |
5.19 ± 0.033 | 6.154 ± 0.041 |
1.785 ± 0.021 | 8.558 ± 0.037 |
8.498 ± 0.065 | 9.173 ± 0.046 |
Met |
Asn |
Gln |
Pro |
Arg |
Ser |
Thr |
Val |
Trp |
Tyr |
|---|---|---|---|---|---|---|---|---|---|
1.939 ± 0.02 | 6.954 ± 0.043 |
3.22 ± 0.026 | 3.159 ± 0.024 |
3.259 ± 0.027 | 6.738 ± 0.037 |
5.946 ± 0.052 | 5.879 ± 0.034 |
1.038 ± 0.015 | 4.157 ± 0.024 |
Most of the basic statistics you can see at this page can be downloaded from this CSV file
See this proteome in:

Proteome-pI is available under Creative Commons Attribution-NoDerivs license, for more details see here
| Reference: Kozlowski LP. Proteome-pI 2.0: Proteome Isoelectric Point Database Update. Nucleic Acids Res. 2021, doi: 10.1093/nar/gkab944 | Contact: Lukasz P. Kozlowski |