Vanilla latent virus
Taxonomy: Viruses; Riboviria; Orthornavirae; Kitrinoviricota; Alsuviricetes; Tymovirales; Alphaflexiviridae; Allexivirus
Average proteome isoelectric point is 6.64
Get precalculated fractions of proteins
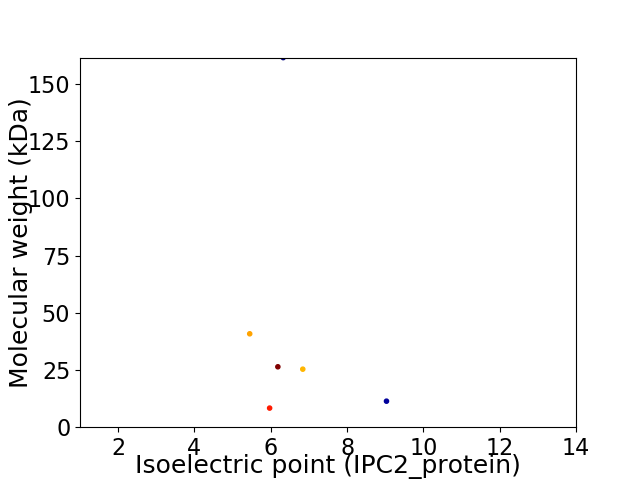
Virtual 2D-PAGE plot for 6 proteins (isoelectric point calculated using IPC2_protein)
Get csv file with sequences according to given criteria:
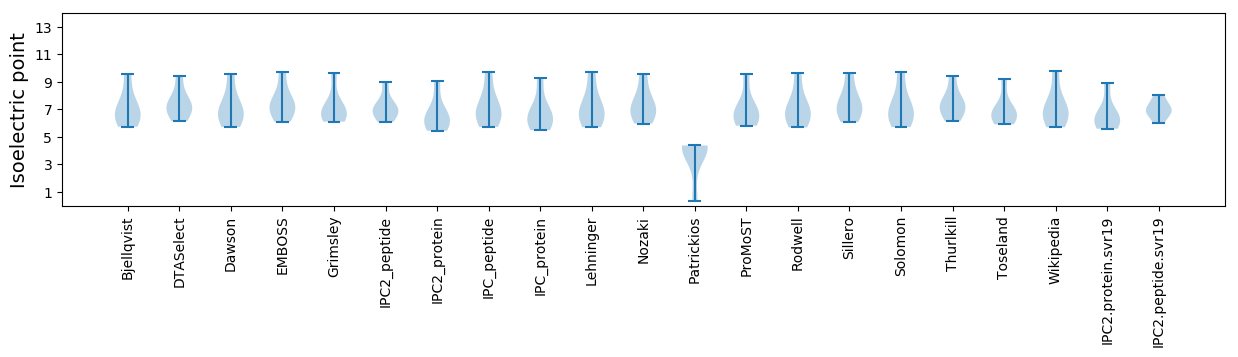
* You can choose from 21 different methods for calculating isoelectric point
Summary statistics related to proteome-wise predictions
Protein with the lowest isoelectric point:
>tr|A0A220NQ61|A0A220NQ61_9VIRU Movement protein TGBp3 OS=Vanilla latent virus OX=2016426 GN=P8 PE=3 SV=1
MM1 pKa = 7.57AFIDD5 pKa = 3.51SATFHH10 pKa = 6.2EE11 pKa = 4.62CHH13 pKa = 6.56RR14 pKa = 11.84NIFRR18 pKa = 11.84WVSDD22 pKa = 2.64VGTQVRR28 pKa = 11.84QAHH31 pKa = 5.87NGIINDD37 pKa = 3.77LQNRR41 pKa = 11.84PTLEE45 pKa = 3.83TLRR48 pKa = 11.84EE49 pKa = 4.18SFRR52 pKa = 11.84VPTAMLQEE60 pKa = 4.12IQNDD64 pKa = 3.42VSAQTSLISNSVINTLQTVTQALEE88 pKa = 4.13QIVAPTSNIAEE99 pKa = 4.06RR100 pKa = 11.84TFTRR104 pKa = 11.84FIPPTQVPMPEE115 pKa = 4.08LQLDD119 pKa = 3.68INTLAGSVQSAHH131 pKa = 6.09MNLLEE136 pKa = 4.61WIMHH140 pKa = 5.94NARR143 pKa = 11.84AIDD146 pKa = 3.55QLQNTIQNLSIGTRR160 pKa = 11.84NVVITAQNQINQKK173 pKa = 10.2LDD175 pKa = 3.4NDD177 pKa = 3.55KK178 pKa = 10.08STLIEE183 pKa = 4.39KK184 pKa = 10.16VDD186 pKa = 3.77SLQHH190 pKa = 6.27LLHH193 pKa = 6.47EE194 pKa = 5.48LKK196 pKa = 10.56QEE198 pKa = 4.29ANQQFNGQALEE209 pKa = 4.92DD210 pKa = 3.74IQSKK214 pKa = 10.94LEE216 pKa = 4.33AIRR219 pKa = 11.84LFITSEE225 pKa = 3.47IPTNHH230 pKa = 6.07GQLINLLHH238 pKa = 6.43EE239 pKa = 4.43LQGNQASTPAQNNLALYY256 pKa = 7.26EE257 pKa = 4.33AQHH260 pKa = 5.53PTINPRR266 pKa = 11.84THH268 pKa = 6.22GRR270 pKa = 11.84LEE272 pKa = 4.09LDD274 pKa = 3.15EE275 pKa = 4.86SYY277 pKa = 10.99IRR279 pKa = 11.84IPMDD283 pKa = 3.18VLQRR287 pKa = 11.84PPSTTLNLKK296 pKa = 10.14IEE298 pKa = 4.15VHH300 pKa = 6.07PKK302 pKa = 6.09QTKK305 pKa = 8.32TEE307 pKa = 3.9VRR309 pKa = 11.84YY310 pKa = 7.7TLHH313 pKa = 7.73DD314 pKa = 3.64EE315 pKa = 4.39FEE317 pKa = 4.48LVFIKK322 pKa = 10.71SLSTPYY328 pKa = 10.62RR329 pKa = 11.84MEE331 pKa = 4.38EE332 pKa = 4.18LPDD335 pKa = 4.26DD336 pKa = 4.57ALSLLHH342 pKa = 5.83CHH344 pKa = 6.59CPRR347 pKa = 11.84FIYY350 pKa = 10.65KK351 pKa = 8.6LTQNNLCC358 pKa = 4.34
MM1 pKa = 7.57AFIDD5 pKa = 3.51SATFHH10 pKa = 6.2EE11 pKa = 4.62CHH13 pKa = 6.56RR14 pKa = 11.84NIFRR18 pKa = 11.84WVSDD22 pKa = 2.64VGTQVRR28 pKa = 11.84QAHH31 pKa = 5.87NGIINDD37 pKa = 3.77LQNRR41 pKa = 11.84PTLEE45 pKa = 3.83TLRR48 pKa = 11.84EE49 pKa = 4.18SFRR52 pKa = 11.84VPTAMLQEE60 pKa = 4.12IQNDD64 pKa = 3.42VSAQTSLISNSVINTLQTVTQALEE88 pKa = 4.13QIVAPTSNIAEE99 pKa = 4.06RR100 pKa = 11.84TFTRR104 pKa = 11.84FIPPTQVPMPEE115 pKa = 4.08LQLDD119 pKa = 3.68INTLAGSVQSAHH131 pKa = 6.09MNLLEE136 pKa = 4.61WIMHH140 pKa = 5.94NARR143 pKa = 11.84AIDD146 pKa = 3.55QLQNTIQNLSIGTRR160 pKa = 11.84NVVITAQNQINQKK173 pKa = 10.2LDD175 pKa = 3.4NDD177 pKa = 3.55KK178 pKa = 10.08STLIEE183 pKa = 4.39KK184 pKa = 10.16VDD186 pKa = 3.77SLQHH190 pKa = 6.27LLHH193 pKa = 6.47EE194 pKa = 5.48LKK196 pKa = 10.56QEE198 pKa = 4.29ANQQFNGQALEE209 pKa = 4.92DD210 pKa = 3.74IQSKK214 pKa = 10.94LEE216 pKa = 4.33AIRR219 pKa = 11.84LFITSEE225 pKa = 3.47IPTNHH230 pKa = 6.07GQLINLLHH238 pKa = 6.43EE239 pKa = 4.43LQGNQASTPAQNNLALYY256 pKa = 7.26EE257 pKa = 4.33AQHH260 pKa = 5.53PTINPRR266 pKa = 11.84THH268 pKa = 6.22GRR270 pKa = 11.84LEE272 pKa = 4.09LDD274 pKa = 3.15EE275 pKa = 4.86SYY277 pKa = 10.99IRR279 pKa = 11.84IPMDD283 pKa = 3.18VLQRR287 pKa = 11.84PPSTTLNLKK296 pKa = 10.14IEE298 pKa = 4.15VHH300 pKa = 6.07PKK302 pKa = 6.09QTKK305 pKa = 8.32TEE307 pKa = 3.9VRR309 pKa = 11.84YY310 pKa = 7.7TLHH313 pKa = 7.73DD314 pKa = 3.64EE315 pKa = 4.39FEE317 pKa = 4.48LVFIKK322 pKa = 10.71SLSTPYY328 pKa = 10.62RR329 pKa = 11.84MEE331 pKa = 4.38EE332 pKa = 4.18LPDD335 pKa = 4.26DD336 pKa = 4.57ALSLLHH342 pKa = 5.83CHH344 pKa = 6.59CPRR347 pKa = 11.84FIYY350 pKa = 10.65KK351 pKa = 8.6LTQNNLCC358 pKa = 4.34
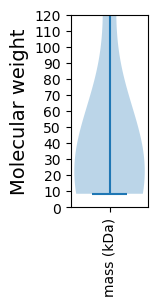
Molecular weight: 40.82 kDa
Isoelectric point according different methods:
Protein with the highest isoelectric point:
>tr|A0A220NQ79|A0A220NQ79_9VIRU Coat protein OS=Vanilla latent virus OX=2016426 GN=CP PE=4 SV=1
MM1 pKa = 7.4SFAPPPDD8 pKa = 3.2HH9 pKa = 7.14SKK11 pKa = 9.79TYY13 pKa = 8.62TALAIGAGAAVILFVLRR30 pKa = 11.84QNTLPHH36 pKa = 6.51VGDD39 pKa = 4.82NIHH42 pKa = 6.59HH43 pKa = 6.84LPHH46 pKa = 6.71GGCYY50 pKa = 9.16QDD52 pKa = 3.15GNKK55 pKa = 10.22RR56 pKa = 11.84ITYY59 pKa = 9.32GRR61 pKa = 11.84LGNTSTHH68 pKa = 4.97SWHH71 pKa = 6.02VLLLIFLLSAAIYY84 pKa = 9.48ISSHH88 pKa = 4.22RR89 pKa = 11.84RR90 pKa = 11.84FRR92 pKa = 11.84VEE94 pKa = 3.36LHH96 pKa = 6.5CAHH99 pKa = 7.26CHH101 pKa = 4.89RR102 pKa = 5.38
MM1 pKa = 7.4SFAPPPDD8 pKa = 3.2HH9 pKa = 7.14SKK11 pKa = 9.79TYY13 pKa = 8.62TALAIGAGAAVILFVLRR30 pKa = 11.84QNTLPHH36 pKa = 6.51VGDD39 pKa = 4.82NIHH42 pKa = 6.59HH43 pKa = 6.84LPHH46 pKa = 6.71GGCYY50 pKa = 9.16QDD52 pKa = 3.15GNKK55 pKa = 10.22RR56 pKa = 11.84ITYY59 pKa = 9.32GRR61 pKa = 11.84LGNTSTHH68 pKa = 4.97SWHH71 pKa = 6.02VLLLIFLLSAAIYY84 pKa = 9.48ISSHH88 pKa = 4.22RR89 pKa = 11.84RR90 pKa = 11.84FRR92 pKa = 11.84VEE94 pKa = 3.36LHH96 pKa = 6.5CAHH99 pKa = 7.26CHH101 pKa = 4.89RR102 pKa = 5.38
Molecular weight: 11.38 kDa
Isoelectric point according different methods:
Peptides (in silico digests for buttom-up proteomics)
Below you can find in silico digests of the whole proteome with Trypsin, Chymotrypsin, Trypsin+LysC, LysN, ArgC proteases suitable for different mass spec machines.| Try ESI |
 |
|---|
| ChTry ESI |
|
|---|
| ArgC ESI |
|
|---|
| LysN ESI |
|
|---|
| TryLysC ESI |
|
|---|
| Try MALDI |
|
|---|
| ChTry MALDI |
|
|---|
| ArgC MALDI |
|
|---|
| LysN MALDI |
|
|---|
| TryLysC MALDI |
|
|---|
| Try LTQ |
|
|---|
| ChTry LTQ |
|
|---|
| ArgC LTQ |
|
|---|
| LysN LTQ |
|
|---|
| TryLysC LTQ |
|
|---|
| Try MSlow |
|
|---|
| ChTry MSlow |
|
|---|
| ArgC MSlow |
|
|---|
| LysN MSlow |
|
|---|
| TryLysC MSlow |
|
|---|
| Try MShigh |
|
|---|
| ChTry MShigh |
|
|---|
| ArgC MShigh |
|
|---|
| LysN MShigh |
|
|---|
| TryLysC MShigh |
|
|---|
General Statistics
Number of major isoforms |
Number of additional isoforms |
Number of all proteins |
Number of amino acids |
Min. Seq. Length |
Max. Seq. Length |
Avg. Seq. Length |
Avg. Mol. Weight |
|---|---|---|---|---|---|---|---|
0 |
2431 |
77 |
1423 |
405.2 |
45.64 |
Amino acid frequency
Ala |
Cys |
Asp |
Glu |
Phe |
Gly |
His |
Ile |
Lys |
Leu |
|---|---|---|---|---|---|---|---|---|---|
7.404 ± 0.759 | 1.399 ± 0.163 |
4.895 ± 0.574 | 5.553 ± 0.61 |
3.949 ± 0.3 | 4.36 ± 0.447 |
3.62 ± 0.9 | 6.376 ± 0.893 |
5.183 ± 0.96 | 9.585 ± 0.859 |
Met |
Asn |
Gln |
Pro |
Arg |
Ser |
Thr |
Val |
Trp |
Tyr |
|---|---|---|---|---|---|---|---|---|---|
2.468 ± 0.577 | 4.648 ± 0.726 |
5.8 ± 0.498 | 5.8 ± 0.584 |
4.689 ± 0.311 | 6.993 ± 0.452 |
8.186 ± 0.468 | 4.977 ± 0.351 |
0.74 ± 0.163 | 3.373 ± 0.395 |
Most of the basic statistics you can see at this page can be downloaded from this CSV file
See this proteome in:

Proteome-pI is available under Creative Commons Attribution-NoDerivs license, for more details see here
| Reference: Kozlowski LP. Proteome-pI 2.0: Proteome Isoelectric Point Database Update. Nucleic Acids Res. 2021, doi: 10.1093/nar/gkab944 | Contact: Lukasz P. Kozlowski |