Sulfurimonas denitrificans (strain ATCC 33889 / DSM 1251) (Thiomicrospira denitrificans (strain ATCC 33889 / DSM 1251))
Taxonomy: cellular organisms; Bacteria; Proteobacteria; delta/epsilon subdivisions; Epsilonproteobacteria; Campylobacterales; Thiovulaceae; Sulfurimonas; Sulfurimonas denitrificans
Average proteome isoelectric point is 6.35
Get precalculated fractions of proteins
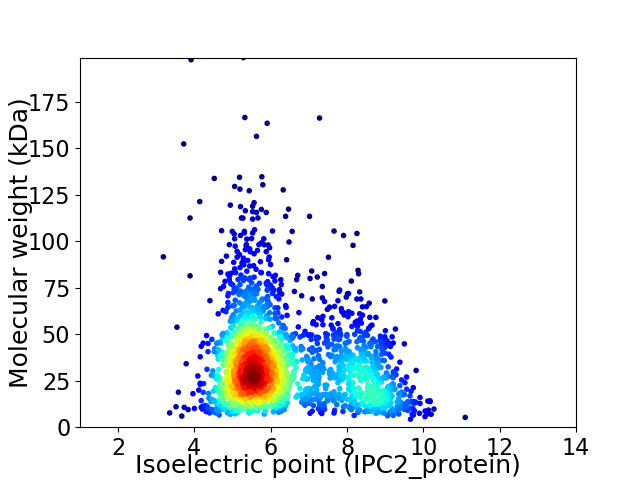
Virtual 2D-PAGE plot for 2084 proteins (isoelectric point calculated using IPC2_protein)
Get csv file with sequences according to given criteria:
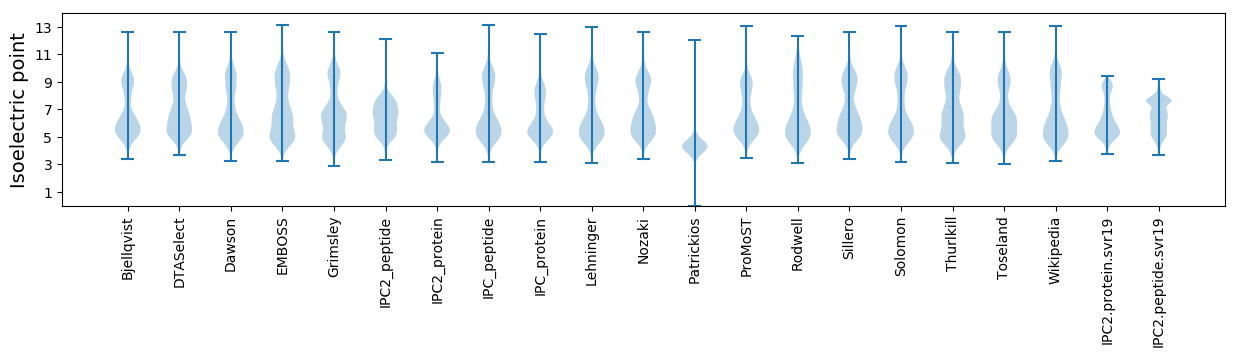
* You can choose from 21 different methods for calculating isoelectric point
Summary statistics related to proteome-wise predictions
Protein with the lowest isoelectric point:
>tr|Q30U07|Q30U07_SULDN Hemolysin-type calcium-binding region OS=Sulfurimonas denitrificans (strain ATCC 33889 / DSM 1251) OX=326298 GN=Suden_0243 PE=4 SV=1
MM1 pKa = 7.79SDD3 pKa = 3.24TGEE6 pKa = 4.11GAALHH11 pKa = 6.33GKK13 pKa = 7.67PTDD16 pKa = 3.36IKK18 pKa = 10.65IDD20 pKa = 3.58ADD22 pKa = 3.69GNFYY26 pKa = 10.92VSHH29 pKa = 6.9FLMLEE34 pKa = 3.49SSGIYY39 pKa = 9.94KK40 pKa = 10.03YY41 pKa = 11.06ASDD44 pKa = 3.81FTEE47 pKa = 3.99VAEE50 pKa = 4.97ISATANTWSMIINNDD65 pKa = 3.37GLIVAGDD72 pKa = 3.74LLISEE77 pKa = 5.1DD78 pKa = 4.06FSIGGEE84 pKa = 3.82IFKK87 pKa = 10.24IDD89 pKa = 3.78TLNYY93 pKa = 9.59ALSGTPDD100 pKa = 3.05SSASGEE106 pKa = 4.02YY107 pKa = 10.47LITLIATDD115 pKa = 3.9ADD117 pKa = 4.24SNATEE122 pKa = 4.05HH123 pKa = 6.35TFTITVNDD131 pKa = 3.74VPEE134 pKa = 4.35SQAAPVIDD142 pKa = 5.0LFTGNGGEE150 pKa = 4.28GTNNFTGEE158 pKa = 4.24SYY160 pKa = 10.97DD161 pKa = 3.75YY162 pKa = 11.51NLVPFTNGASPISDD176 pKa = 3.5ADD178 pKa = 3.74STEE181 pKa = 3.98LQSLKK186 pKa = 10.51ISIPTAQLTRR196 pKa = 11.84EE197 pKa = 4.37SYY199 pKa = 10.25TEE201 pKa = 3.83YY202 pKa = 10.21LTDD205 pKa = 5.68GGGDD209 pKa = 3.13WDD211 pKa = 3.84IQIDD215 pKa = 4.09LNLNYY220 pKa = 9.88VGSYY224 pKa = 6.42TTPDD228 pKa = 3.11GNITFDD234 pKa = 3.8LQSSVIDD241 pKa = 3.79NNCVITFTGQNGNAEE256 pKa = 4.14SVAAFNEE263 pKa = 4.28LLSLLHH269 pKa = 5.93YY270 pKa = 10.04RR271 pKa = 11.84YY272 pKa = 10.84NNGKK276 pKa = 9.43VIQGGLEE283 pKa = 3.69SHH285 pKa = 5.96QRR287 pKa = 11.84TFSITAVDD295 pKa = 3.47AEE297 pKa = 4.68GNEE300 pKa = 4.31TTTPATFTVAPGGGYY315 pKa = 10.04CCTRR319 pKa = 11.84II320 pKa = 3.82
MM1 pKa = 7.79SDD3 pKa = 3.24TGEE6 pKa = 4.11GAALHH11 pKa = 6.33GKK13 pKa = 7.67PTDD16 pKa = 3.36IKK18 pKa = 10.65IDD20 pKa = 3.58ADD22 pKa = 3.69GNFYY26 pKa = 10.92VSHH29 pKa = 6.9FLMLEE34 pKa = 3.49SSGIYY39 pKa = 9.94KK40 pKa = 10.03YY41 pKa = 11.06ASDD44 pKa = 3.81FTEE47 pKa = 3.99VAEE50 pKa = 4.97ISATANTWSMIINNDD65 pKa = 3.37GLIVAGDD72 pKa = 3.74LLISEE77 pKa = 5.1DD78 pKa = 4.06FSIGGEE84 pKa = 3.82IFKK87 pKa = 10.24IDD89 pKa = 3.78TLNYY93 pKa = 9.59ALSGTPDD100 pKa = 3.05SSASGEE106 pKa = 4.02YY107 pKa = 10.47LITLIATDD115 pKa = 3.9ADD117 pKa = 4.24SNATEE122 pKa = 4.05HH123 pKa = 6.35TFTITVNDD131 pKa = 3.74VPEE134 pKa = 4.35SQAAPVIDD142 pKa = 5.0LFTGNGGEE150 pKa = 4.28GTNNFTGEE158 pKa = 4.24SYY160 pKa = 10.97DD161 pKa = 3.75YY162 pKa = 11.51NLVPFTNGASPISDD176 pKa = 3.5ADD178 pKa = 3.74STEE181 pKa = 3.98LQSLKK186 pKa = 10.51ISIPTAQLTRR196 pKa = 11.84EE197 pKa = 4.37SYY199 pKa = 10.25TEE201 pKa = 3.83YY202 pKa = 10.21LTDD205 pKa = 5.68GGGDD209 pKa = 3.13WDD211 pKa = 3.84IQIDD215 pKa = 4.09LNLNYY220 pKa = 9.88VGSYY224 pKa = 6.42TTPDD228 pKa = 3.11GNITFDD234 pKa = 3.8LQSSVIDD241 pKa = 3.79NNCVITFTGQNGNAEE256 pKa = 4.14SVAAFNEE263 pKa = 4.28LLSLLHH269 pKa = 5.93YY270 pKa = 10.04RR271 pKa = 11.84YY272 pKa = 10.84NNGKK276 pKa = 9.43VIQGGLEE283 pKa = 3.69SHH285 pKa = 5.96QRR287 pKa = 11.84TFSITAVDD295 pKa = 3.47AEE297 pKa = 4.68GNEE300 pKa = 4.31TTTPATFTVAPGGGYY315 pKa = 10.04CCTRR319 pKa = 11.84II320 pKa = 3.82
Molecular weight: 34.12 kDa
Isoelectric point according different methods:
Protein with the highest isoelectric point:
>tr|Q30T88|Q30T88_SULDN Heat shock protein Hsp20 OS=Sulfurimonas denitrificans (strain ATCC 33889 / DSM 1251) OX=326298 GN=Suden_0513 PE=3 SV=1
MM1 pKa = 7.28KK2 pKa = 9.44RR3 pKa = 11.84TYY5 pKa = 10.03QPHH8 pKa = 5.1NRR10 pKa = 11.84PRR12 pKa = 11.84KK13 pKa = 7.47STHH16 pKa = 4.7GFRR19 pKa = 11.84ARR21 pKa = 11.84MATKK25 pKa = 10.4NGRR28 pKa = 11.84NVINRR33 pKa = 11.84RR34 pKa = 11.84RR35 pKa = 11.84AKK37 pKa = 9.96GRR39 pKa = 11.84KK40 pKa = 8.53KK41 pKa = 10.86LSVV44 pKa = 3.15
MM1 pKa = 7.28KK2 pKa = 9.44RR3 pKa = 11.84TYY5 pKa = 10.03QPHH8 pKa = 5.1NRR10 pKa = 11.84PRR12 pKa = 11.84KK13 pKa = 7.47STHH16 pKa = 4.7GFRR19 pKa = 11.84ARR21 pKa = 11.84MATKK25 pKa = 10.4NGRR28 pKa = 11.84NVINRR33 pKa = 11.84RR34 pKa = 11.84RR35 pKa = 11.84AKK37 pKa = 9.96GRR39 pKa = 11.84KK40 pKa = 8.53KK41 pKa = 10.86LSVV44 pKa = 3.15
Molecular weight: 5.26 kDa
Isoelectric point according different methods:
Peptides (in silico digests for buttom-up proteomics)
Below you can find in silico digests of the whole proteome with Trypsin, Chymotrypsin, Trypsin+LysC, LysN, ArgC proteases suitable for different mass spec machines.| Try ESI |
 |
|---|
| ChTry ESI |
|
|---|
| ArgC ESI |
|
|---|
| LysN ESI |
|
|---|
| TryLysC ESI |
|
|---|
| Try MALDI |
|
|---|
| ChTry MALDI |
|
|---|
| ArgC MALDI |
|
|---|
| LysN MALDI |
|
|---|
| TryLysC MALDI |
|
|---|
| Try LTQ |
|
|---|
| ChTry LTQ |
|
|---|
| ArgC LTQ |
|
|---|
| LysN LTQ |
|
|---|
| TryLysC LTQ |
|
|---|
| Try MSlow |
|
|---|
| ChTry MSlow |
|
|---|
| ArgC MSlow |
|
|---|
| LysN MSlow |
|
|---|
| TryLysC MSlow |
|
|---|
| Try MShigh |
|
|---|
| ChTry MShigh |
|
|---|
| ArgC MShigh |
|
|---|
| LysN MShigh |
|
|---|
| TryLysC MShigh |
|
|---|
General Statistics
Number of major isoforms |
Number of additional isoforms |
Number of all proteins |
Number of amino acids |
Min. Seq. Length |
Max. Seq. Length |
Avg. Seq. Length |
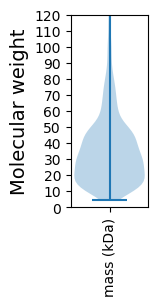
Avg. Mol. Weight |
|---|---|---|---|---|---|---|---|
0 |
674622 |
37 |
1864 |
323.7 |
36.5 |
Amino acid frequency
Ala |
Cys |
Asp |
Glu |
Phe |
Gly |
His |
Ile |
Lys |
Leu |
|---|---|---|---|---|---|---|---|---|---|
6.857 ± 0.057 | 0.848 ± 0.02 |
5.725 ± 0.04 | 7.182 ± 0.054 |
4.985 ± 0.044 | 5.704 ± 0.051 |
1.873 ± 0.023 | 8.741 ± 0.048 |
8.406 ± 0.051 | 9.769 ± 0.056 |
Met |
Asn |
Gln |
Pro |
Arg |
Ser |
Thr |
Val |
Trp |
Tyr |
|---|---|---|---|---|---|---|---|---|---|
2.62 ± 0.026 | 5.244 ± 0.04 |
2.78 ± 0.033 | 2.873 ± 0.024 |
3.453 ± 0.035 | 7.319 ± 0.039 |
4.937 ± 0.058 | 6.136 ± 0.041 |
0.697 ± 0.017 | 3.849 ± 0.035 |
Most of the basic statistics you can see at this page can be downloaded from this CSV file
See this proteome in:

Proteome-pI is available under Creative Commons Attribution-NoDerivs license, for more details see here
| Reference: Kozlowski LP. Proteome-pI 2.0: Proteome Isoelectric Point Database Update. Nucleic Acids Res. 2021, doi: 10.1093/nar/gkab944 | Contact: Lukasz P. Kozlowski |