Aquimarina aggregata
Taxonomy: cellular organisms; Bacteria; FCB group; Bacteroidetes/Chlorobi group; Bacteroidetes; Flavobacteriia; Flavobacteriales; Flavobacteriaceae; Aquimarina
Average proteome isoelectric point is 6.68
Get precalculated fractions of proteins
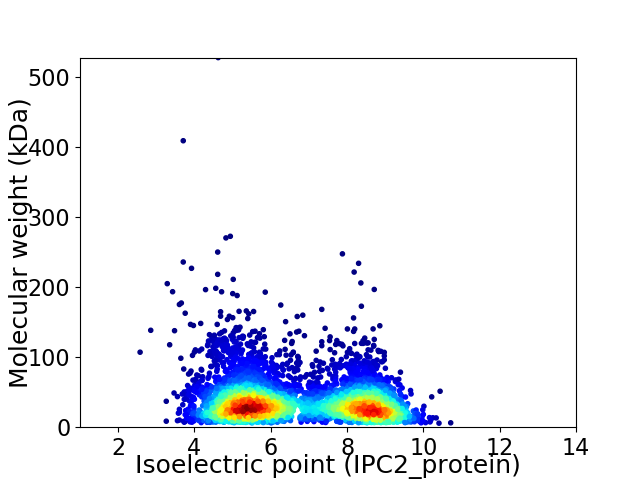
Virtual 2D-PAGE plot for 5047 proteins (isoelectric point calculated using IPC2_protein)
Get csv file with sequences according to given criteria:
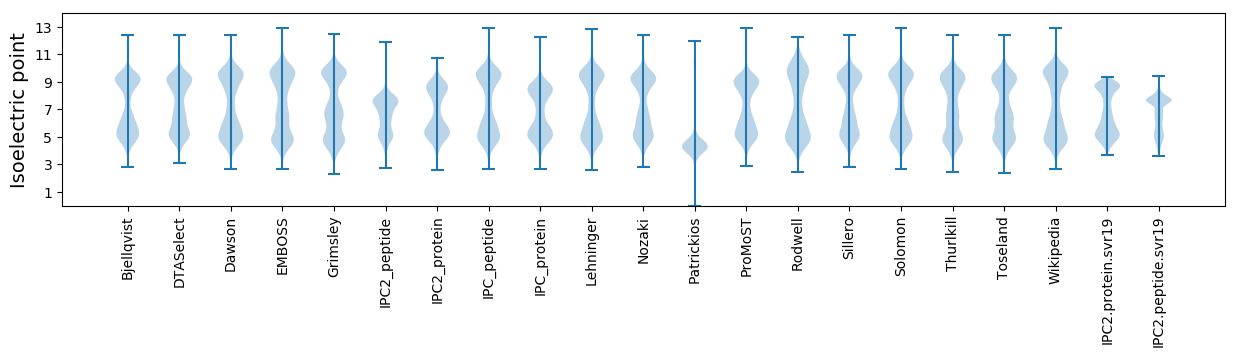
* You can choose from 21 different methods for calculating isoelectric point
Summary statistics related to proteome-wise predictions
Protein with the lowest isoelectric point:
>tr|A0A163BYT3|A0A163BYT3_9FLAO Uncharacterized protein OS=Aquimarina aggregata OX=1642818 GN=AWE51_00215 PE=4 SV=1
MM1 pKa = 7.52FLQLLIILNFKK12 pKa = 10.25LMKK15 pKa = 9.2QLFYY19 pKa = 10.94IFILLLGFTSCEE31 pKa = 3.8DD32 pKa = 3.75VIDD35 pKa = 3.74VDD37 pKa = 4.27VPNGEE42 pKa = 3.92PRR44 pKa = 11.84LVVDD48 pKa = 5.14ASFEE52 pKa = 4.35VYY54 pKa = 10.61LNEE57 pKa = 4.6VPVTVKK63 pKa = 10.91NSIQLSLSAPFFGNTIPKK81 pKa = 10.08VNDD84 pKa = 3.07ATVFITDD91 pKa = 4.63LSDD94 pKa = 3.31GTIINYY100 pKa = 8.74TEE102 pKa = 4.03TNGTGFYY109 pKa = 10.18IPSSTFLPEE118 pKa = 3.85FNVDD122 pKa = 3.45YY123 pKa = 10.43EE124 pKa = 4.08LTIIYY129 pKa = 10.52NSEE132 pKa = 4.01TYY134 pKa = 10.52KK135 pKa = 10.53ATTQMFASVPIDD147 pKa = 3.89NIEE150 pKa = 4.12QGDD153 pKa = 3.96GTLFEE158 pKa = 4.95GDD160 pKa = 3.26EE161 pKa = 4.41TEE163 pKa = 4.73IIVSFTDD170 pKa = 3.46DD171 pKa = 3.2GARR174 pKa = 11.84DD175 pKa = 3.78DD176 pKa = 5.55FYY178 pKa = 11.62LFNFDD183 pKa = 4.26FDD185 pKa = 4.28LLEE188 pKa = 4.15VSEE191 pKa = 4.29DD192 pKa = 2.95RR193 pKa = 11.84FYY195 pKa = 11.17QGEE198 pKa = 4.5SFNFSYY204 pKa = 10.16FYY206 pKa = 11.24EE207 pKa = 4.73DD208 pKa = 2.89VTAGQNITIKK218 pKa = 10.54ILGIDD223 pKa = 3.21KK224 pKa = 10.83RR225 pKa = 11.84FFNYY229 pKa = 10.35AGLLIDD235 pKa = 5.12QSDD238 pKa = 4.12PDD240 pKa = 3.9GGGPFATPPALLRR253 pKa = 11.84GNVINTTNSDD263 pKa = 3.63NYY265 pKa = 11.1ALGYY269 pKa = 10.65FNLSEE274 pKa = 4.48ANQLDD279 pKa = 3.91FTIQEE284 pKa = 4.32KK285 pKa = 10.71
MM1 pKa = 7.52FLQLLIILNFKK12 pKa = 10.25LMKK15 pKa = 9.2QLFYY19 pKa = 10.94IFILLLGFTSCEE31 pKa = 3.8DD32 pKa = 3.75VIDD35 pKa = 3.74VDD37 pKa = 4.27VPNGEE42 pKa = 3.92PRR44 pKa = 11.84LVVDD48 pKa = 5.14ASFEE52 pKa = 4.35VYY54 pKa = 10.61LNEE57 pKa = 4.6VPVTVKK63 pKa = 10.91NSIQLSLSAPFFGNTIPKK81 pKa = 10.08VNDD84 pKa = 3.07ATVFITDD91 pKa = 4.63LSDD94 pKa = 3.31GTIINYY100 pKa = 8.74TEE102 pKa = 4.03TNGTGFYY109 pKa = 10.18IPSSTFLPEE118 pKa = 3.85FNVDD122 pKa = 3.45YY123 pKa = 10.43EE124 pKa = 4.08LTIIYY129 pKa = 10.52NSEE132 pKa = 4.01TYY134 pKa = 10.52KK135 pKa = 10.53ATTQMFASVPIDD147 pKa = 3.89NIEE150 pKa = 4.12QGDD153 pKa = 3.96GTLFEE158 pKa = 4.95GDD160 pKa = 3.26EE161 pKa = 4.41TEE163 pKa = 4.73IIVSFTDD170 pKa = 3.46DD171 pKa = 3.2GARR174 pKa = 11.84DD175 pKa = 3.78DD176 pKa = 5.55FYY178 pKa = 11.62LFNFDD183 pKa = 4.26FDD185 pKa = 4.28LLEE188 pKa = 4.15VSEE191 pKa = 4.29DD192 pKa = 2.95RR193 pKa = 11.84FYY195 pKa = 11.17QGEE198 pKa = 4.5SFNFSYY204 pKa = 10.16FYY206 pKa = 11.24EE207 pKa = 4.73DD208 pKa = 2.89VTAGQNITIKK218 pKa = 10.54ILGIDD223 pKa = 3.21KK224 pKa = 10.83RR225 pKa = 11.84FFNYY229 pKa = 10.35AGLLIDD235 pKa = 5.12QSDD238 pKa = 4.12PDD240 pKa = 3.9GGGPFATPPALLRR253 pKa = 11.84GNVINTTNSDD263 pKa = 3.63NYY265 pKa = 11.1ALGYY269 pKa = 10.65FNLSEE274 pKa = 4.48ANQLDD279 pKa = 3.91FTIQEE284 pKa = 4.32KK285 pKa = 10.71
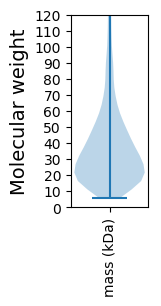
Molecular weight: 32.08 kDa
Isoelectric point according different methods:
Protein with the highest isoelectric point:
>tr|A0A162XJN4|A0A162XJN4_9FLAO HTH luxR-type domain-containing protein OS=Aquimarina aggregata OX=1642818 GN=AWE51_13885 PE=3 SV=1
MM1 pKa = 7.45KK2 pKa = 9.59RR3 pKa = 11.84TFQPSKK9 pKa = 10.15RR10 pKa = 11.84KK11 pKa = 9.6RR12 pKa = 11.84KK13 pKa = 8.29NKK15 pKa = 9.34HH16 pKa = 4.03GFRR19 pKa = 11.84EE20 pKa = 4.05RR21 pKa = 11.84MASVNGRR28 pKa = 11.84KK29 pKa = 9.21VLARR33 pKa = 11.84RR34 pKa = 11.84RR35 pKa = 11.84AKK37 pKa = 9.92GRR39 pKa = 11.84KK40 pKa = 8.34KK41 pKa = 10.22ISVSSEE47 pKa = 3.56LRR49 pKa = 11.84HH50 pKa = 5.43KK51 pKa = 10.29HH52 pKa = 5.04
MM1 pKa = 7.45KK2 pKa = 9.59RR3 pKa = 11.84TFQPSKK9 pKa = 10.15RR10 pKa = 11.84KK11 pKa = 9.6RR12 pKa = 11.84KK13 pKa = 8.29NKK15 pKa = 9.34HH16 pKa = 4.03GFRR19 pKa = 11.84EE20 pKa = 4.05RR21 pKa = 11.84MASVNGRR28 pKa = 11.84KK29 pKa = 9.21VLARR33 pKa = 11.84RR34 pKa = 11.84RR35 pKa = 11.84AKK37 pKa = 9.92GRR39 pKa = 11.84KK40 pKa = 8.34KK41 pKa = 10.22ISVSSEE47 pKa = 3.56LRR49 pKa = 11.84HH50 pKa = 5.43KK51 pKa = 10.29HH52 pKa = 5.04
Molecular weight: 6.26 kDa
Isoelectric point according different methods:
Peptides (in silico digests for buttom-up proteomics)
Below you can find in silico digests of the whole proteome with Trypsin, Chymotrypsin, Trypsin+LysC, LysN, ArgC proteases suitable for different mass spec machines.| Try ESI |
 |
|---|
| ChTry ESI |
|
|---|
| ArgC ESI |
|
|---|
| LysN ESI |
|
|---|
| TryLysC ESI |
|
|---|
| Try MALDI |
|
|---|
| ChTry MALDI |
|
|---|
| ArgC MALDI |
|
|---|
| LysN MALDI |
|
|---|
| TryLysC MALDI |
|
|---|
| Try LTQ |
|
|---|
| ChTry LTQ |
|
|---|
| ArgC LTQ |
|
|---|
| LysN LTQ |
|
|---|
| TryLysC LTQ |
|
|---|
| Try MSlow |
|
|---|
| ChTry MSlow |
|
|---|
| ArgC MSlow |
|
|---|
| LysN MSlow |
|
|---|
| TryLysC MSlow |
|
|---|
| Try MShigh |
|
|---|
| ChTry MShigh |
|
|---|
| ArgC MShigh |
|
|---|
| LysN MShigh |
|
|---|
| TryLysC MShigh |
|
|---|
General Statistics
Number of major isoforms |
Number of additional isoforms |
Number of all proteins |
Number of amino acids |
Min. Seq. Length |
Max. Seq. Length |
Avg. Seq. Length |
Avg. Mol. Weight |
|---|---|---|---|---|---|---|---|
0 |
1774003 |
49 |
4566 |
351.5 |
39.73 |
Amino acid frequency
Ala |
Cys |
Asp |
Glu |
Phe |
Gly |
His |
Ile |
Lys |
Leu |
|---|---|---|---|---|---|---|---|---|---|
5.826 ± 0.036 | 0.736 ± 0.011 |
5.738 ± 0.03 | 6.38 ± 0.032 |
5.187 ± 0.028 | 6.385 ± 0.035 |
1.772 ± 0.016 | 8.365 ± 0.038 |
7.988 ± 0.051 | 8.989 ± 0.042 |
Met |
Asn |
Gln |
Pro |
Arg |
Ser |
Thr |
Val |
Trp |
Tyr |
|---|---|---|---|---|---|---|---|---|---|
1.95 ± 0.018 | 6.497 ± 0.039 |
3.352 ± 0.023 | 3.412 ± 0.019 |
3.417 ± 0.018 | 6.705 ± 0.031 |
6.168 ± 0.043 | 5.89 ± 0.026 |
1.112 ± 0.013 | 4.131 ± 0.028 |
Most of the basic statistics you can see at this page can be downloaded from this CSV file
See this proteome in:

Proteome-pI is available under Creative Commons Attribution-NoDerivs license, for more details see here
| Reference: Kozlowski LP. Proteome-pI 2.0: Proteome Isoelectric Point Database Update. Nucleic Acids Res. 2021, doi: 10.1093/nar/gkab944 | Contact: Lukasz P. Kozlowski |