Shigella dysenteriae serotype 1 (strain Sd197)
Taxonomy: cellular organisms; Bacteria; Proteobacteria; Gammaproteobacteria; Enterobacterales; Enterobacteriaceae; Shigella; Shigella dysenteriae
Average proteome isoelectric point is 6.77
Get precalculated fractions of proteins
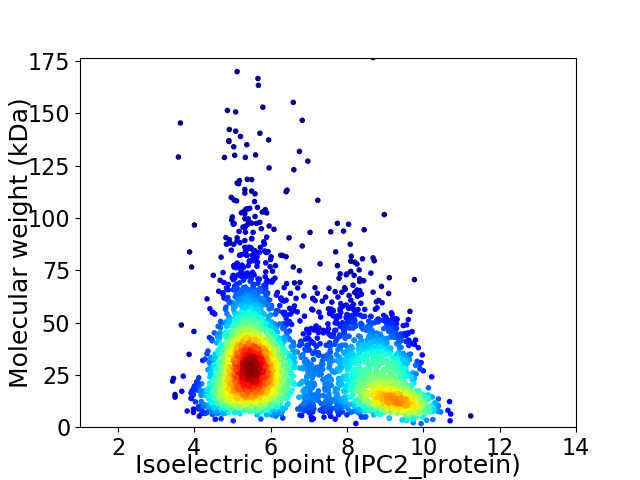
Virtual 2D-PAGE plot for 3897 proteins (isoelectric point calculated using IPC2_protein)
Get csv file with sequences according to given criteria:
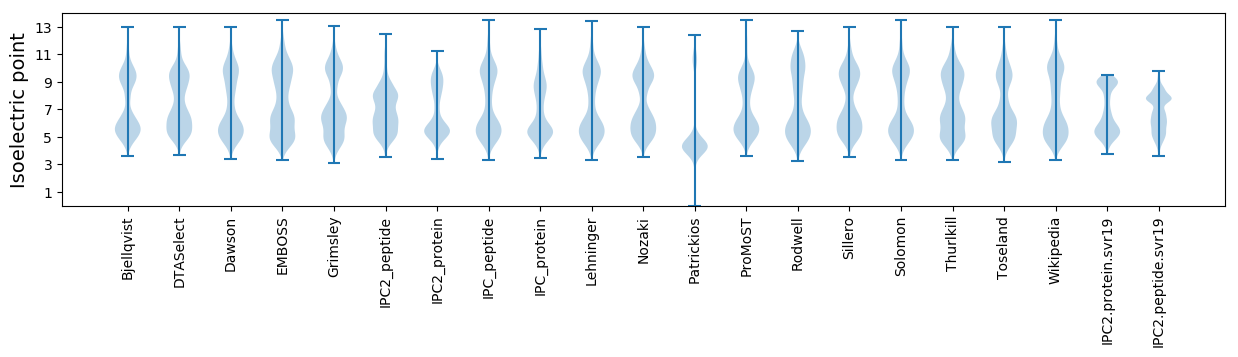
* You can choose from 21 different methods for calculating isoelectric point
Summary statistics related to proteome-wise predictions
Protein with the lowest isoelectric point:
>tr|Q32J74|Q32J74_SHIDS Uncharacterized protein OS=Shigella dysenteriae serotype 1 (strain Sd197) OX=300267 GN=SDY_0422 PE=4 SV=1
MM1 pKa = 7.44GVTAAQVSAWPAGTVNIAVSGEE23 pKa = 4.02SSAGNPISITHH34 pKa = 6.85PVTVDD39 pKa = 3.37LTPAAITINTIATDD53 pKa = 3.79DD54 pKa = 4.18VINAAEE60 pKa = 4.24KK61 pKa = 10.47GANLTLSGTTTNVEE75 pKa = 3.87AGQTVTVTFGGKK87 pKa = 9.87NYY89 pKa = 7.45TASVAGDD96 pKa = 3.94GSWTATVPAADD107 pKa = 4.29LAALPEE113 pKa = 4.73GSASAQASVSNINGNSASAVHH134 pKa = 6.47NYY136 pKa = 10.21SVDD139 pKa = 3.25SSAPTIIINTVASDD153 pKa = 4.03NIVNASEE160 pKa = 4.07ADD162 pKa = 3.3AGVTVSGSTTAEE174 pKa = 3.75AGQIVTITLNSPTVQTYY191 pKa = 8.96QATVQADD198 pKa = 4.12GSWSINIPAADD209 pKa = 4.62LEE211 pKa = 4.22ALTDD215 pKa = 4.13GSHH218 pKa = 6.42TLTATVNDD226 pKa = 4.06KK227 pKa = 11.14AGNPASTTHH236 pKa = 6.32NLAVDD241 pKa = 3.83LTVPVLTINTIAGDD255 pKa = 4.23DD256 pKa = 3.92IINATEE262 pKa = 4.03HH263 pKa = 5.67GQALVISGSSTGGEE277 pKa = 3.94AGDD280 pKa = 3.77VVSVTLNSKK289 pKa = 9.05TYY291 pKa = 7.54TTTLDD296 pKa = 3.47ASGNWSVGVPAADD309 pKa = 3.56VTALGSGPQTVTATVTDD326 pKa = 3.67AAGNSDD332 pKa = 4.11NEE334 pKa = 4.52THH336 pKa = 5.96TVTVNLTAPTIGINTIATDD355 pKa = 3.7DD356 pKa = 4.25VINATEE362 pKa = 4.42KK363 pKa = 11.1GADD366 pKa = 3.7LQISGTSNQPAGTTITVTLNGQNYY390 pKa = 7.45TATTDD395 pKa = 3.95ASGNWSTTVPASAVGALGEE414 pKa = 3.99ASYY417 pKa = 9.98TVTANVTDD425 pKa = 3.6SAGNSNSASHH435 pKa = 6.17NVQVNTALPGVTLNPVASDD454 pKa = 4.36DD455 pKa = 4.26IINAAEE461 pKa = 4.13SGVAQTISGQVTGAAAGDD479 pKa = 4.13TVTVTLGGKK488 pKa = 8.14TYY490 pKa = 9.31TATVAGWW497 pKa = 3.03
MM1 pKa = 7.44GVTAAQVSAWPAGTVNIAVSGEE23 pKa = 4.02SSAGNPISITHH34 pKa = 6.85PVTVDD39 pKa = 3.37LTPAAITINTIATDD53 pKa = 3.79DD54 pKa = 4.18VINAAEE60 pKa = 4.24KK61 pKa = 10.47GANLTLSGTTTNVEE75 pKa = 3.87AGQTVTVTFGGKK87 pKa = 9.87NYY89 pKa = 7.45TASVAGDD96 pKa = 3.94GSWTATVPAADD107 pKa = 4.29LAALPEE113 pKa = 4.73GSASAQASVSNINGNSASAVHH134 pKa = 6.47NYY136 pKa = 10.21SVDD139 pKa = 3.25SSAPTIIINTVASDD153 pKa = 4.03NIVNASEE160 pKa = 4.07ADD162 pKa = 3.3AGVTVSGSTTAEE174 pKa = 3.75AGQIVTITLNSPTVQTYY191 pKa = 8.96QATVQADD198 pKa = 4.12GSWSINIPAADD209 pKa = 4.62LEE211 pKa = 4.22ALTDD215 pKa = 4.13GSHH218 pKa = 6.42TLTATVNDD226 pKa = 4.06KK227 pKa = 11.14AGNPASTTHH236 pKa = 6.32NLAVDD241 pKa = 3.83LTVPVLTINTIAGDD255 pKa = 4.23DD256 pKa = 3.92IINATEE262 pKa = 4.03HH263 pKa = 5.67GQALVISGSSTGGEE277 pKa = 3.94AGDD280 pKa = 3.77VVSVTLNSKK289 pKa = 9.05TYY291 pKa = 7.54TTTLDD296 pKa = 3.47ASGNWSVGVPAADD309 pKa = 3.56VTALGSGPQTVTATVTDD326 pKa = 3.67AAGNSDD332 pKa = 4.11NEE334 pKa = 4.52THH336 pKa = 5.96TVTVNLTAPTIGINTIATDD355 pKa = 3.7DD356 pKa = 4.25VINATEE362 pKa = 4.42KK363 pKa = 11.1GADD366 pKa = 3.7LQISGTSNQPAGTTITVTLNGQNYY390 pKa = 7.45TATTDD395 pKa = 3.95ASGNWSTTVPASAVGALGEE414 pKa = 3.99ASYY417 pKa = 9.98TVTANVTDD425 pKa = 3.6SAGNSNSASHH435 pKa = 6.17NVQVNTALPGVTLNPVASDD454 pKa = 4.36DD455 pKa = 4.26IINAAEE461 pKa = 4.13SGVAQTISGQVTGAAAGDD479 pKa = 4.13TVTVTLGGKK488 pKa = 8.14TYY490 pKa = 9.31TATVAGWW497 pKa = 3.03
Molecular weight: 48.81 kDa
Isoelectric point according different methods:
Protein with the highest isoelectric point:
>tr|Q329J2|Q329J2_SHIDS Uncharacterized protein OS=Shigella dysenteriae serotype 1 (strain Sd197) OX=300267 GN=yjdB PE=4 SV=1
MM1 pKa = 7.45KK2 pKa = 9.51RR3 pKa = 11.84TFQPSVLKK11 pKa = 10.6RR12 pKa = 11.84NRR14 pKa = 11.84SHH16 pKa = 7.16GFRR19 pKa = 11.84ARR21 pKa = 11.84MATKK25 pKa = 10.4NGRR28 pKa = 11.84QVLARR33 pKa = 11.84RR34 pKa = 11.84RR35 pKa = 11.84AKK37 pKa = 10.22GRR39 pKa = 11.84ARR41 pKa = 11.84LTVSKK46 pKa = 10.99
MM1 pKa = 7.45KK2 pKa = 9.51RR3 pKa = 11.84TFQPSVLKK11 pKa = 10.6RR12 pKa = 11.84NRR14 pKa = 11.84SHH16 pKa = 7.16GFRR19 pKa = 11.84ARR21 pKa = 11.84MATKK25 pKa = 10.4NGRR28 pKa = 11.84QVLARR33 pKa = 11.84RR34 pKa = 11.84RR35 pKa = 11.84AKK37 pKa = 10.22GRR39 pKa = 11.84ARR41 pKa = 11.84LTVSKK46 pKa = 10.99
Molecular weight: 5.38 kDa
Isoelectric point according different methods:
Peptides (in silico digests for buttom-up proteomics)
Below you can find in silico digests of the whole proteome with Trypsin, Chymotrypsin, Trypsin+LysC, LysN, ArgC proteases suitable for different mass spec machines.| Try ESI |
 |
|---|
| ChTry ESI |
|
|---|
| ArgC ESI |
|
|---|
| LysN ESI |
|
|---|
| TryLysC ESI |
|
|---|
| Try MALDI |
|
|---|
| ChTry MALDI |
|
|---|
| ArgC MALDI |
|
|---|
| LysN MALDI |
|
|---|
| TryLysC MALDI |
|
|---|
| Try LTQ |
|
|---|
| ChTry LTQ |
|
|---|
| ArgC LTQ |
|
|---|
| LysN LTQ |
|
|---|
| TryLysC LTQ |
|
|---|
| Try MSlow |
|
|---|
| ChTry MSlow |
|
|---|
| ArgC MSlow |
|
|---|
| LysN MSlow |
|
|---|
| TryLysC MSlow |
|
|---|
| Try MShigh |
|
|---|
| ChTry MShigh |
|
|---|
| ArgC MShigh |
|
|---|
| LysN MShigh |
|
|---|
| TryLysC MShigh |
|
|---|
General Statistics
Number of major isoforms |
Number of additional isoforms |
Number of all proteins |
Number of amino acids |
Min. Seq. Length |
Max. Seq. Length |
Avg. Seq. Length |
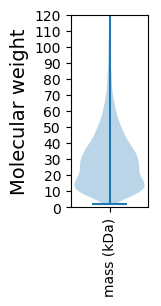
Avg. Mol. Weight |
|---|---|---|---|---|---|---|---|
0 |
1094416 |
14 |
1588 |
280.8 |
31.19 |
Amino acid frequency
Ala |
Cys |
Asp |
Glu |
Phe |
Gly |
His |
Ile |
Lys |
Leu |
|---|---|---|---|---|---|---|---|---|---|
9.419 ± 0.042 | 1.191 ± 0.016 |
5.098 ± 0.033 | 5.846 ± 0.04 |
3.796 ± 0.028 | 7.23 ± 0.043 |
2.321 ± 0.018 | 5.86 ± 0.032 |
4.476 ± 0.035 | 10.701 ± 0.049 |
Met |
Asn |
Gln |
Pro |
Arg |
Ser |
Thr |
Val |
Trp |
Tyr |
|---|---|---|---|---|---|---|---|---|---|
2.869 ± 0.02 | 3.883 ± 0.026 |
4.354 ± 0.023 | 4.433 ± 0.033 |
5.884 ± 0.039 | 5.815 ± 0.033 |
5.451 ± 0.035 | 7.022 ± 0.034 |
1.516 ± 0.018 | 2.836 ± 0.025 |
Most of the basic statistics you can see at this page can be downloaded from this CSV file
See this proteome in:

Proteome-pI is available under Creative Commons Attribution-NoDerivs license, for more details see here
| Reference: Kozlowski LP. Proteome-pI 2.0: Proteome Isoelectric Point Database Update. Nucleic Acids Res. 2021, doi: 10.1093/nar/gkab944 | Contact: Lukasz P. Kozlowski |