Burkholderia sp. JS23
Taxonomy: cellular organisms; Bacteria; Proteobacteria; Betaproteobacteria; Burkholderiales; Burkholderiaceae; Chitinasiproducens
Average proteome isoelectric point is 6.92
Get precalculated fractions of proteins
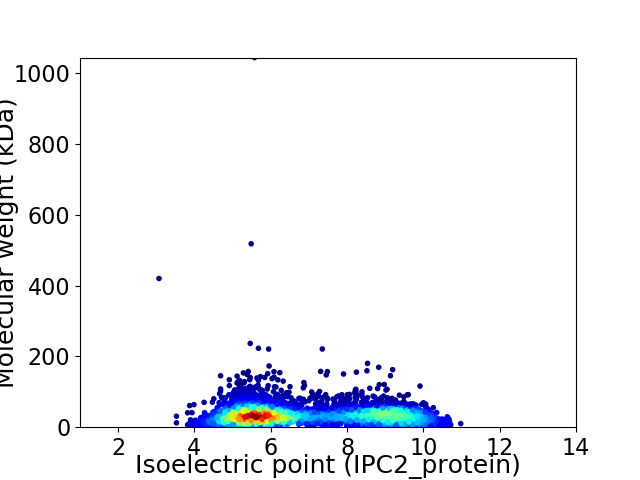
Virtual 2D-PAGE plot for 4543 proteins (isoelectric point calculated using IPC2_protein)
Get csv file with sequences according to given criteria:
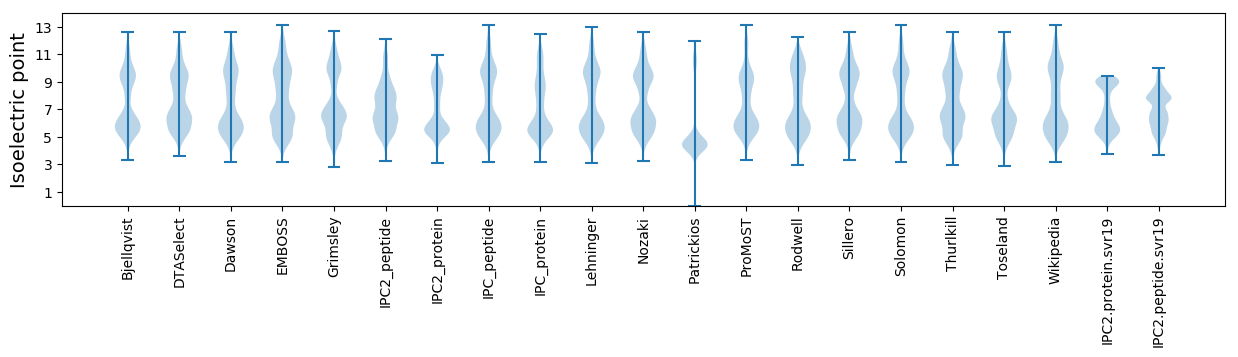
* You can choose from 21 different methods for calculating isoelectric point
Summary statistics related to proteome-wise predictions
Protein with the lowest isoelectric point:
>tr|A0A1H2PK27|A0A1H2PK27_9BURK Uncharacterized protein OS=Burkholderia sp. JS23 OX=1770053 GN=SAMN05216551_101607 PE=4 SV=1
MM1 pKa = 7.44SSSLFGIGLSGINAAQYY18 pKa = 11.6GLTTTGQNISNASTDD33 pKa = 3.03GYY35 pKa = 9.19TRR37 pKa = 11.84EE38 pKa = 4.29SVSLKK43 pKa = 10.33QSSAQYY49 pKa = 9.87TGAGYY54 pKa = 10.47LGTGVSVEE62 pKa = 4.47TVTRR66 pKa = 11.84AYY68 pKa = 10.75SQTLTTQLNNAQSTGSALDD87 pKa = 3.85AYY89 pKa = 9.21QTLSSSLDD97 pKa = 3.48SLLGDD102 pKa = 3.9PSAGIGAQMDD112 pKa = 4.01NFLTAASTVASNPSSAAARR131 pKa = 11.84EE132 pKa = 4.22SLLGQANTLASLITSTATQLQSLRR156 pKa = 11.84DD157 pKa = 3.95SVNSQLDD164 pKa = 3.74SAVSGINAAAASIASLNTQIQAASATGQTPNSLLDD199 pKa = 3.45EE200 pKa = 4.79RR201 pKa = 11.84DD202 pKa = 3.5RR203 pKa = 11.84QVAALSKK210 pKa = 9.85LVNVSVVTQSDD221 pKa = 3.47GSYY224 pKa = 10.37GVYY227 pKa = 10.14VGSGQTLVMGSRR239 pKa = 11.84SYY241 pKa = 11.77ALAAVPSTSEE251 pKa = 3.88AGEE254 pKa = 3.76QTVAYY259 pKa = 10.54VSGTGDD265 pKa = 2.9ATQYY269 pKa = 11.06LDD271 pKa = 3.73EE272 pKa = 4.64STLSGGTLGGLLSFRR287 pKa = 11.84RR288 pKa = 11.84EE289 pKa = 3.91MLDD292 pKa = 3.37PVSDD296 pKa = 3.54RR297 pKa = 11.84VGVVAAAFAGAVNGQNEE314 pKa = 4.37AGLTLGGSQGGALFTVGQPSVTAAPGNAGNAALGASIGDD353 pKa = 3.67ATALTGDD360 pKa = 4.55NYY362 pKa = 10.7TLSYY366 pKa = 10.56DD367 pKa = 3.67GKK369 pKa = 11.13SYY371 pKa = 9.41TLTNQTTGATSSPDD385 pKa = 3.29LSTGSVTVDD394 pKa = 3.01GVSYY398 pKa = 9.29TLSGTMQAGDD408 pKa = 3.85RR409 pKa = 11.84FSIAPTRR416 pKa = 11.84NAAAGFAVATSDD428 pKa = 3.18TSAIAAASPVTTAAASTNAGTGTISASADD457 pKa = 2.86ASYY460 pKa = 10.55FGSPLASAVTLSYY473 pKa = 11.09SGTDD477 pKa = 3.33GTLSGFPSAVTVSTGSSTTTYY498 pKa = 9.62PAGSAVPYY506 pKa = 9.17TAGASYY512 pKa = 11.37AFGGVTLTLAGTPKK526 pKa = 10.08TGDD529 pKa = 3.6SFTVAANTALSGDD542 pKa = 3.88GSNATAIGKK551 pKa = 9.1LADD554 pKa = 3.56AKK556 pKa = 11.06VIGGSTLSDD565 pKa = 3.29AYY567 pKa = 10.9ANLVTQVGTLAARR580 pKa = 11.84VEE582 pKa = 4.6SSNTTQTTLITSLSTQQQSVSGVNLDD608 pKa = 3.65EE609 pKa = 4.44EE610 pKa = 4.59AANLLQYY617 pKa = 9.99QQMYY621 pKa = 8.66QASSKK626 pKa = 10.25IIQTATTLFDD636 pKa = 4.42TILGLSNN643 pKa = 3.58
MM1 pKa = 7.44SSSLFGIGLSGINAAQYY18 pKa = 11.6GLTTTGQNISNASTDD33 pKa = 3.03GYY35 pKa = 9.19TRR37 pKa = 11.84EE38 pKa = 4.29SVSLKK43 pKa = 10.33QSSAQYY49 pKa = 9.87TGAGYY54 pKa = 10.47LGTGVSVEE62 pKa = 4.47TVTRR66 pKa = 11.84AYY68 pKa = 10.75SQTLTTQLNNAQSTGSALDD87 pKa = 3.85AYY89 pKa = 9.21QTLSSSLDD97 pKa = 3.48SLLGDD102 pKa = 3.9PSAGIGAQMDD112 pKa = 4.01NFLTAASTVASNPSSAAARR131 pKa = 11.84EE132 pKa = 4.22SLLGQANTLASLITSTATQLQSLRR156 pKa = 11.84DD157 pKa = 3.95SVNSQLDD164 pKa = 3.74SAVSGINAAAASIASLNTQIQAASATGQTPNSLLDD199 pKa = 3.45EE200 pKa = 4.79RR201 pKa = 11.84DD202 pKa = 3.5RR203 pKa = 11.84QVAALSKK210 pKa = 9.85LVNVSVVTQSDD221 pKa = 3.47GSYY224 pKa = 10.37GVYY227 pKa = 10.14VGSGQTLVMGSRR239 pKa = 11.84SYY241 pKa = 11.77ALAAVPSTSEE251 pKa = 3.88AGEE254 pKa = 3.76QTVAYY259 pKa = 10.54VSGTGDD265 pKa = 2.9ATQYY269 pKa = 11.06LDD271 pKa = 3.73EE272 pKa = 4.64STLSGGTLGGLLSFRR287 pKa = 11.84RR288 pKa = 11.84EE289 pKa = 3.91MLDD292 pKa = 3.37PVSDD296 pKa = 3.54RR297 pKa = 11.84VGVVAAAFAGAVNGQNEE314 pKa = 4.37AGLTLGGSQGGALFTVGQPSVTAAPGNAGNAALGASIGDD353 pKa = 3.67ATALTGDD360 pKa = 4.55NYY362 pKa = 10.7TLSYY366 pKa = 10.56DD367 pKa = 3.67GKK369 pKa = 11.13SYY371 pKa = 9.41TLTNQTTGATSSPDD385 pKa = 3.29LSTGSVTVDD394 pKa = 3.01GVSYY398 pKa = 9.29TLSGTMQAGDD408 pKa = 3.85RR409 pKa = 11.84FSIAPTRR416 pKa = 11.84NAAAGFAVATSDD428 pKa = 3.18TSAIAAASPVTTAAASTNAGTGTISASADD457 pKa = 2.86ASYY460 pKa = 10.55FGSPLASAVTLSYY473 pKa = 11.09SGTDD477 pKa = 3.33GTLSGFPSAVTVSTGSSTTTYY498 pKa = 9.62PAGSAVPYY506 pKa = 9.17TAGASYY512 pKa = 11.37AFGGVTLTLAGTPKK526 pKa = 10.08TGDD529 pKa = 3.6SFTVAANTALSGDD542 pKa = 3.88GSNATAIGKK551 pKa = 9.1LADD554 pKa = 3.56AKK556 pKa = 11.06VIGGSTLSDD565 pKa = 3.29AYY567 pKa = 10.9ANLVTQVGTLAARR580 pKa = 11.84VEE582 pKa = 4.6SSNTTQTTLITSLSTQQQSVSGVNLDD608 pKa = 3.65EE609 pKa = 4.44EE610 pKa = 4.59AANLLQYY617 pKa = 9.99QQMYY621 pKa = 8.66QASSKK626 pKa = 10.25IIQTATTLFDD636 pKa = 4.42TILGLSNN643 pKa = 3.58
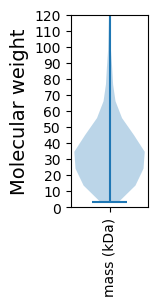
Molecular weight: 63.69 kDa
Isoelectric point according different methods:
Protein with the highest isoelectric point:
>tr|A0A1H2PP40|A0A1H2PP40_9BURK Transcriptional regulator LysR family OS=Burkholderia sp. JS23 OX=1770053 GN=SAMN05216551_10491 PE=3 SV=1
MM1 pKa = 7.41GRR3 pKa = 11.84PGFAPAGQRR12 pKa = 11.84HH13 pKa = 4.96GRR15 pKa = 11.84NRR17 pKa = 11.84LASARR22 pKa = 11.84HH23 pKa = 5.2SRR25 pKa = 11.84RR26 pKa = 11.84QARR29 pKa = 11.84WTLSRR34 pKa = 11.84RR35 pKa = 11.84HH36 pKa = 5.73EE37 pKa = 4.29FLSEE41 pKa = 3.81HH42 pKa = 5.12NMKK45 pKa = 9.29RR46 pKa = 11.84TYY48 pKa = 10.12QPSVTRR54 pKa = 11.84RR55 pKa = 11.84KK56 pKa = 8.0RR57 pKa = 11.84THH59 pKa = 5.76GFRR62 pKa = 11.84VRR64 pKa = 11.84MKK66 pKa = 9.13TVGGRR71 pKa = 11.84KK72 pKa = 9.2VINARR77 pKa = 11.84RR78 pKa = 11.84AKK80 pKa = 9.58GRR82 pKa = 11.84KK83 pKa = 8.75RR84 pKa = 11.84LAVV87 pKa = 3.41
MM1 pKa = 7.41GRR3 pKa = 11.84PGFAPAGQRR12 pKa = 11.84HH13 pKa = 4.96GRR15 pKa = 11.84NRR17 pKa = 11.84LASARR22 pKa = 11.84HH23 pKa = 5.2SRR25 pKa = 11.84RR26 pKa = 11.84QARR29 pKa = 11.84WTLSRR34 pKa = 11.84RR35 pKa = 11.84HH36 pKa = 5.73EE37 pKa = 4.29FLSEE41 pKa = 3.81HH42 pKa = 5.12NMKK45 pKa = 9.29RR46 pKa = 11.84TYY48 pKa = 10.12QPSVTRR54 pKa = 11.84RR55 pKa = 11.84KK56 pKa = 8.0RR57 pKa = 11.84THH59 pKa = 5.76GFRR62 pKa = 11.84VRR64 pKa = 11.84MKK66 pKa = 9.13TVGGRR71 pKa = 11.84KK72 pKa = 9.2VINARR77 pKa = 11.84RR78 pKa = 11.84AKK80 pKa = 9.58GRR82 pKa = 11.84KK83 pKa = 8.75RR84 pKa = 11.84LAVV87 pKa = 3.41
Molecular weight: 10.24 kDa
Isoelectric point according different methods:
Peptides (in silico digests for buttom-up proteomics)
Below you can find in silico digests of the whole proteome with Trypsin, Chymotrypsin, Trypsin+LysC, LysN, ArgC proteases suitable for different mass spec machines.| Try ESI |
 |
|---|
| ChTry ESI |
|
|---|
| ArgC ESI |
|
|---|
| LysN ESI |
|
|---|
| TryLysC ESI |
|
|---|
| Try MALDI |
|
|---|
| ChTry MALDI |
|
|---|
| ArgC MALDI |
|
|---|
| LysN MALDI |
|
|---|
| TryLysC MALDI |
|
|---|
| Try LTQ |
|
|---|
| ChTry LTQ |
|
|---|
| ArgC LTQ |
|
|---|
| LysN LTQ |
|
|---|
| TryLysC LTQ |
|
|---|
| Try MSlow |
|
|---|
| ChTry MSlow |
|
|---|
| ArgC MSlow |
|
|---|
| LysN MSlow |
|
|---|
| TryLysC MSlow |
|
|---|
| Try MShigh |
|
|---|
| ChTry MShigh |
|
|---|
| ArgC MShigh |
|
|---|
| LysN MShigh |
|
|---|
| TryLysC MShigh |
|
|---|
General Statistics
Number of major isoforms |
Number of additional isoforms |
Number of all proteins |
Number of amino acids |
Min. Seq. Length |
Max. Seq. Length |
Avg. Seq. Length |
Avg. Mol. Weight |
|---|---|---|---|---|---|---|---|
0 |
1518797 |
29 |
9752 |
334.3 |
36.06 |
Amino acid frequency
Ala |
Cys |
Asp |
Glu |
Phe |
Gly |
His |
Ile |
Lys |
Leu |
|---|---|---|---|---|---|---|---|---|---|
14.036 ± 0.053 | 0.956 ± 0.011 |
5.66 ± 0.035 | 4.843 ± 0.035 |
3.461 ± 0.022 | 8.393 ± 0.033 |
2.186 ± 0.015 | 4.258 ± 0.025 |
2.381 ± 0.029 | 10.451 ± 0.047 |
Met |
Asn |
Gln |
Pro |
Arg |
Ser |
Thr |
Val |
Trp |
Tyr |
|---|---|---|---|---|---|---|---|---|---|
2.177 ± 0.017 | 2.381 ± 0.022 |
5.308 ± 0.025 | 3.44 ± 0.026 |
7.952 ± 0.043 | 5.563 ± 0.033 |
5.315 ± 0.048 | 7.674 ± 0.026 |
1.333 ± 0.014 | 2.232 ± 0.018 |
Most of the basic statistics you can see at this page can be downloaded from this CSV file
See this proteome in:

Proteome-pI is available under Creative Commons Attribution-NoDerivs license, for more details see here
| Reference: Kozlowski LP. Proteome-pI 2.0: Proteome Isoelectric Point Database Update. Nucleic Acids Res. 2021, doi: 10.1093/nar/gkab944 | Contact: Lukasz P. Kozlowski |