Flavobacterium tangerina
Taxonomy: cellular organisms; Bacteria; FCB group; Bacteroidetes/Chlorobi group; Bacteroidetes; Flavobacteriia; Flavobacteriales; Flavobacteriaceae; Flavobacterium
Average proteome isoelectric point is 6.42
Get precalculated fractions of proteins
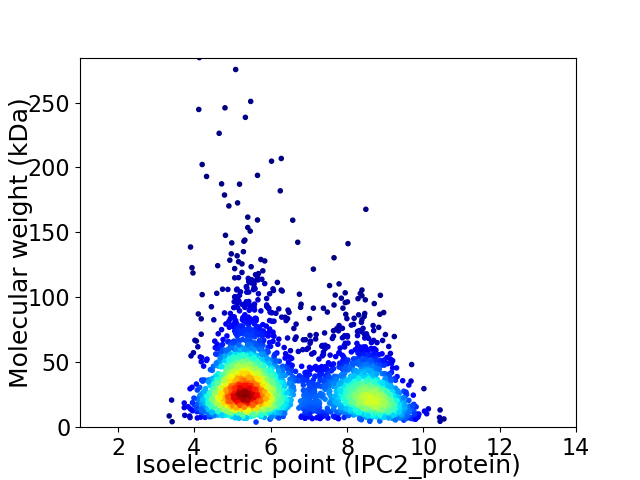
Virtual 2D-PAGE plot for 3128 proteins (isoelectric point calculated using IPC2_protein)
Get csv file with sequences according to given criteria:
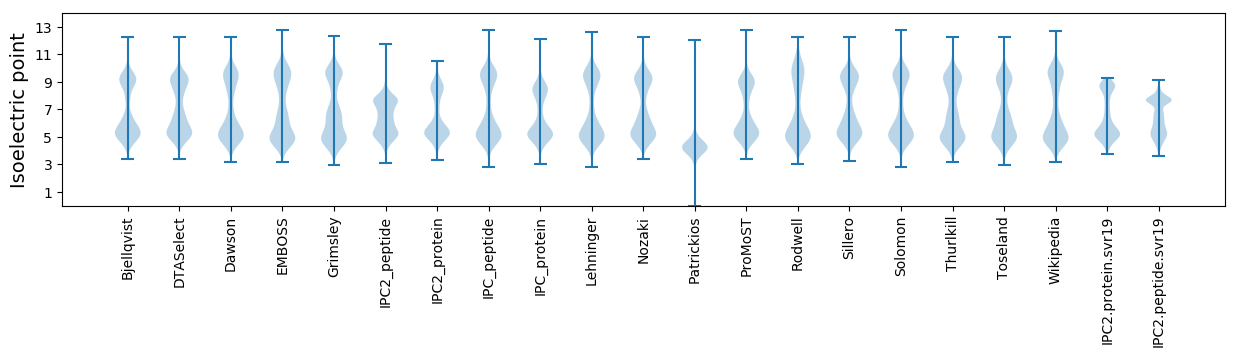
* You can choose from 21 different methods for calculating isoelectric point
Summary statistics related to proteome-wise predictions
Protein with the lowest isoelectric point:
>tr|A0A3P3WA51|A0A3P3WA51_9FLAO 30S ribosomal protein S17 OS=Flavobacterium tangerina OX=2488728 GN=rpsQ PE=3 SV=1
MM1 pKa = 7.58KK2 pKa = 10.39KK3 pKa = 8.68NTILLVIAFFGSITINAQTIASEE26 pKa = 4.17NFEE29 pKa = 4.43TTGLYY34 pKa = 10.16DD35 pKa = 5.18LPVGWFANGDD45 pKa = 3.54FFYY48 pKa = 11.13DD49 pKa = 3.77SFVDD53 pKa = 4.89DD54 pKa = 4.52YY55 pKa = 12.01YY56 pKa = 11.61GGCEE60 pKa = 4.05DD61 pKa = 3.73EE62 pKa = 4.88QYY64 pKa = 10.92IYY66 pKa = 11.26TNLFEE71 pKa = 5.9SDD73 pKa = 3.32SQLFLTSQNYY83 pKa = 10.35LNLNAGPKK91 pKa = 8.64QVSYY95 pKa = 9.05QLRR98 pKa = 11.84VIDD101 pKa = 4.57YY102 pKa = 10.59DD103 pKa = 4.16DD104 pKa = 4.38EE105 pKa = 5.21VPVNYY110 pKa = 10.21DD111 pKa = 3.18FGSITFSYY119 pKa = 10.54SLNDD123 pKa = 3.39GVTWIVLGSVSEE135 pKa = 4.97DD136 pKa = 2.99NFTPSLACQEE146 pKa = 3.52ISYY149 pKa = 9.23TIEE152 pKa = 4.14GSLIAAQSNLKK163 pKa = 10.06FKK165 pKa = 10.44WEE167 pKa = 3.93SAYY170 pKa = 11.02SGEE173 pKa = 4.0GDD175 pKa = 3.99YY176 pKa = 11.21EE177 pKa = 3.95ILIDD181 pKa = 4.49NFMLSEE187 pKa = 4.17SQTASTNEE195 pKa = 3.71LDD197 pKa = 3.69KK198 pKa = 11.33SQLKK202 pKa = 10.08IYY204 pKa = 7.98PNPVSDD210 pKa = 4.58VLNIDD215 pKa = 3.57YY216 pKa = 10.87SSTISKK222 pKa = 9.66FIIFDD227 pKa = 3.6LVGRR231 pKa = 11.84KK232 pKa = 8.97IGEE235 pKa = 4.02FSNSGNLNSIDD246 pKa = 3.77VSNLSTGTYY255 pKa = 9.5LLKK258 pKa = 10.43IQTEE262 pKa = 4.5DD263 pKa = 3.3NSQSTIKK270 pKa = 10.42FIKK273 pKa = 9.94KK274 pKa = 9.77
MM1 pKa = 7.58KK2 pKa = 10.39KK3 pKa = 8.68NTILLVIAFFGSITINAQTIASEE26 pKa = 4.17NFEE29 pKa = 4.43TTGLYY34 pKa = 10.16DD35 pKa = 5.18LPVGWFANGDD45 pKa = 3.54FFYY48 pKa = 11.13DD49 pKa = 3.77SFVDD53 pKa = 4.89DD54 pKa = 4.52YY55 pKa = 12.01YY56 pKa = 11.61GGCEE60 pKa = 4.05DD61 pKa = 3.73EE62 pKa = 4.88QYY64 pKa = 10.92IYY66 pKa = 11.26TNLFEE71 pKa = 5.9SDD73 pKa = 3.32SQLFLTSQNYY83 pKa = 10.35LNLNAGPKK91 pKa = 8.64QVSYY95 pKa = 9.05QLRR98 pKa = 11.84VIDD101 pKa = 4.57YY102 pKa = 10.59DD103 pKa = 4.16DD104 pKa = 4.38EE105 pKa = 5.21VPVNYY110 pKa = 10.21DD111 pKa = 3.18FGSITFSYY119 pKa = 10.54SLNDD123 pKa = 3.39GVTWIVLGSVSEE135 pKa = 4.97DD136 pKa = 2.99NFTPSLACQEE146 pKa = 3.52ISYY149 pKa = 9.23TIEE152 pKa = 4.14GSLIAAQSNLKK163 pKa = 10.06FKK165 pKa = 10.44WEE167 pKa = 3.93SAYY170 pKa = 11.02SGEE173 pKa = 4.0GDD175 pKa = 3.99YY176 pKa = 11.21EE177 pKa = 3.95ILIDD181 pKa = 4.49NFMLSEE187 pKa = 4.17SQTASTNEE195 pKa = 3.71LDD197 pKa = 3.69KK198 pKa = 11.33SQLKK202 pKa = 10.08IYY204 pKa = 7.98PNPVSDD210 pKa = 4.58VLNIDD215 pKa = 3.57YY216 pKa = 10.87SSTISKK222 pKa = 9.66FIIFDD227 pKa = 3.6LVGRR231 pKa = 11.84KK232 pKa = 8.97IGEE235 pKa = 4.02FSNSGNLNSIDD246 pKa = 3.77VSNLSTGTYY255 pKa = 9.5LLKK258 pKa = 10.43IQTEE262 pKa = 4.5DD263 pKa = 3.3NSQSTIKK270 pKa = 10.42FIKK273 pKa = 9.94KK274 pKa = 9.77
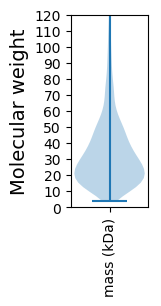
Molecular weight: 30.75 kDa
Isoelectric point according different methods:
Protein with the highest isoelectric point:
>tr|A0A3P3W2K8|A0A3P3W2K8_9FLAO Pseudouridylate synthase OS=Flavobacterium tangerina OX=2488728 GN=EG240_13850 PE=4 SV=1
MM1 pKa = 7.5KK2 pKa = 10.33KK3 pKa = 10.41SILIKK8 pKa = 10.35IFGLVFIFTLCLQSCGSFNNNPQRR32 pKa = 11.84EE33 pKa = 4.02VDD35 pKa = 3.38RR36 pKa = 11.84QQNQNSTIRR45 pKa = 11.84NNTSRR50 pKa = 11.84NDD52 pKa = 3.42SNRR55 pKa = 11.84GSNSNNSRR63 pKa = 11.84EE64 pKa = 4.26NNTSNRR70 pKa = 11.84NNSNRR75 pKa = 11.84NTEE78 pKa = 4.22QKK80 pKa = 10.64SEE82 pKa = 3.87TRR84 pKa = 11.84TSEE87 pKa = 3.58EE88 pKa = 3.91RR89 pKa = 11.84KK90 pKa = 9.94IKK92 pKa = 10.62
MM1 pKa = 7.5KK2 pKa = 10.33KK3 pKa = 10.41SILIKK8 pKa = 10.35IFGLVFIFTLCLQSCGSFNNNPQRR32 pKa = 11.84EE33 pKa = 4.02VDD35 pKa = 3.38RR36 pKa = 11.84QQNQNSTIRR45 pKa = 11.84NNTSRR50 pKa = 11.84NDD52 pKa = 3.42SNRR55 pKa = 11.84GSNSNNSRR63 pKa = 11.84EE64 pKa = 4.26NNTSNRR70 pKa = 11.84NNSNRR75 pKa = 11.84NTEE78 pKa = 4.22QKK80 pKa = 10.64SEE82 pKa = 3.87TRR84 pKa = 11.84TSEE87 pKa = 3.58EE88 pKa = 3.91RR89 pKa = 11.84KK90 pKa = 9.94IKK92 pKa = 10.62
Molecular weight: 10.65 kDa
Isoelectric point according different methods:
Peptides (in silico digests for buttom-up proteomics)
Below you can find in silico digests of the whole proteome with Trypsin, Chymotrypsin, Trypsin+LysC, LysN, ArgC proteases suitable for different mass spec machines.| Try ESI |
 |
|---|
| ChTry ESI |
|
|---|
| ArgC ESI |
|
|---|
| LysN ESI |
|
|---|
| TryLysC ESI |
|
|---|
| Try MALDI |
|
|---|
| ChTry MALDI |
|
|---|
| ArgC MALDI |
|
|---|
| LysN MALDI |
|
|---|
| TryLysC MALDI |
|
|---|
| Try LTQ |
|
|---|
| ChTry LTQ |
|
|---|
| ArgC LTQ |
|
|---|
| LysN LTQ |
|
|---|
| TryLysC LTQ |
|
|---|
| Try MSlow |
|
|---|
| ChTry MSlow |
|
|---|
| ArgC MSlow |
|
|---|
| LysN MSlow |
|
|---|
| TryLysC MSlow |
|
|---|
| Try MShigh |
|
|---|
| ChTry MShigh |
|
|---|
| ArgC MShigh |
|
|---|
| LysN MShigh |
|
|---|
| TryLysC MShigh |
|
|---|
General Statistics
Number of major isoforms |
Number of additional isoforms |
Number of all proteins |
Number of amino acids |
Min. Seq. Length |
Max. Seq. Length |
Avg. Seq. Length |
Avg. Mol. Weight |
|---|---|---|---|---|---|---|---|
0 |
991835 |
34 |
2656 |
317.1 |
36.02 |
Amino acid frequency
Ala |
Cys |
Asp |
Glu |
Phe |
Gly |
His |
Ile |
Lys |
Leu |
|---|---|---|---|---|---|---|---|---|---|
5.803 ± 0.042 | 0.773 ± 0.013 |
5.384 ± 0.031 | 6.843 ± 0.048 |
5.698 ± 0.04 | 5.774 ± 0.049 |
1.604 ± 0.022 | 8.578 ± 0.051 |
8.169 ± 0.052 | 9.18 ± 0.042 |
Met |
Asn |
Gln |
Pro |
Arg |
Ser |
Thr |
Val |
Trp |
Tyr |
|---|---|---|---|---|---|---|---|---|---|
2.158 ± 0.021 | 6.985 ± 0.049 |
3.151 ± 0.026 | 3.564 ± 0.028 |
3.062 ± 0.03 | 6.433 ± 0.037 |
5.626 ± 0.046 | 6.038 ± 0.04 |
0.935 ± 0.015 | 4.242 ± 0.029 |
Most of the basic statistics you can see at this page can be downloaded from this CSV file
See this proteome in:

Proteome-pI is available under Creative Commons Attribution-NoDerivs license, for more details see here
| Reference: Kozlowski LP. Proteome-pI 2.0: Proteome Isoelectric Point Database Update. Nucleic Acids Res. 2021, doi: 10.1093/nar/gkab944 | Contact: Lukasz P. Kozlowski |