Bacteriophage vB_NpeS-2AV2
Taxonomy: Viruses; Duplodnaviria; Heunggongvirae; Uroviricota; Caudoviricetes; Caudovirales; Siphoviridae; Ravarandavirus; Nodularia virus 2AV2
Average proteome isoelectric point is 6.51
Get precalculated fractions of proteins
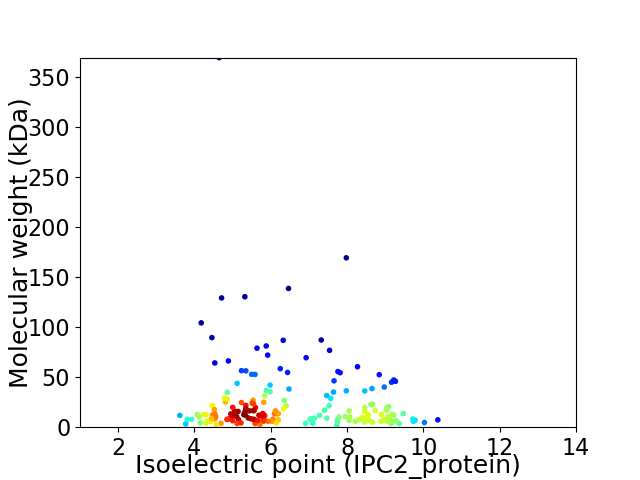
Virtual 2D-PAGE plot for 182 proteins (isoelectric point calculated using IPC2_protein)
Get csv file with sequences according to given criteria:
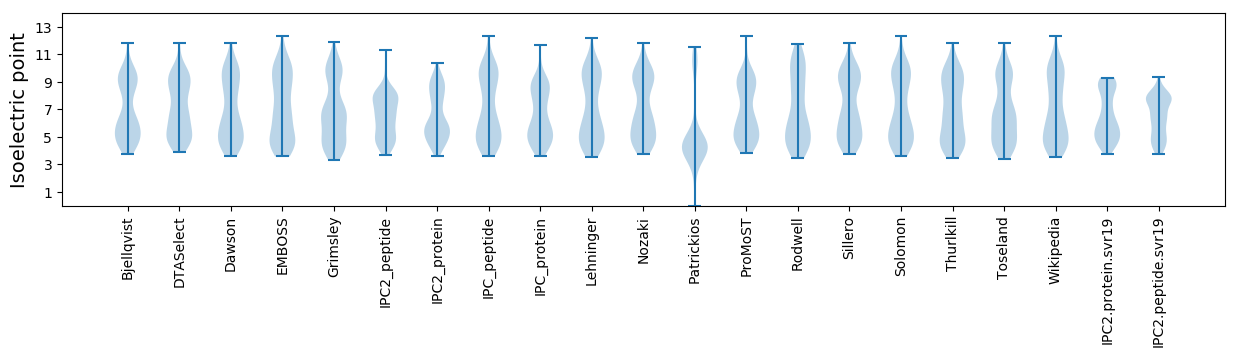
* You can choose from 21 different methods for calculating isoelectric point
Summary statistics related to proteome-wise predictions
Protein with the lowest isoelectric point:
>tr|A0A1L2BWU0|A0A1L2BWU0_9CAUD Uncharacterized protein OS=Bacteriophage vB_NpeS-2AV2 OX=1777122 GN=2AV2_57 PE=4 SV=1
MM1 pKa = 7.09SQLKK5 pKa = 9.91IVEE8 pKa = 4.54DD9 pKa = 3.63NLFVFVLNFSDD20 pKa = 3.91TVVDD24 pKa = 4.82LYY26 pKa = 11.39EE27 pKa = 3.9VLKK30 pKa = 10.99VYY32 pKa = 10.38NQYY35 pKa = 11.71AFLSDD40 pKa = 5.08DD41 pKa = 4.54FFPDD45 pKa = 2.9IYY47 pKa = 11.46EE48 pKa = 4.14NLCVNAYY55 pKa = 8.31NARR58 pKa = 11.84NMEE61 pKa = 4.46DD62 pKa = 3.33LRR64 pKa = 11.84II65 pKa = 3.93
MM1 pKa = 7.09SQLKK5 pKa = 9.91IVEE8 pKa = 4.54DD9 pKa = 3.63NLFVFVLNFSDD20 pKa = 3.91TVVDD24 pKa = 4.82LYY26 pKa = 11.39EE27 pKa = 3.9VLKK30 pKa = 10.99VYY32 pKa = 10.38NQYY35 pKa = 11.71AFLSDD40 pKa = 5.08DD41 pKa = 4.54FFPDD45 pKa = 2.9IYY47 pKa = 11.46EE48 pKa = 4.14NLCVNAYY55 pKa = 8.31NARR58 pKa = 11.84NMEE61 pKa = 4.46DD62 pKa = 3.33LRR64 pKa = 11.84II65 pKa = 3.93
Molecular weight: 7.74 kDa
Isoelectric point according different methods:
Protein with the highest isoelectric point:
>tr|A0A1L2BWT1|A0A1L2BWT1_9CAUD Uncharacterized protein OS=Bacteriophage vB_NpeS-2AV2 OX=1777122 GN=2AV2_42 PE=4 SV=1
MM1 pKa = 7.47IIVRR5 pKa = 11.84GDD7 pKa = 3.12RR8 pKa = 11.84FRR10 pKa = 11.84DD11 pKa = 3.5VRR13 pKa = 11.84VCCLLLIGAKK23 pKa = 9.45KK24 pKa = 8.21WWVVTGNSKK33 pKa = 10.25LLKK36 pKa = 9.83ICSTNVWTTRR46 pKa = 11.84AKK48 pKa = 10.78NKK50 pKa = 10.44LKK52 pKa = 10.63GRR54 pKa = 11.84SPWVYY59 pKa = 10.92
MM1 pKa = 7.47IIVRR5 pKa = 11.84GDD7 pKa = 3.12RR8 pKa = 11.84FRR10 pKa = 11.84DD11 pKa = 3.5VRR13 pKa = 11.84VCCLLLIGAKK23 pKa = 9.45KK24 pKa = 8.21WWVVTGNSKK33 pKa = 10.25LLKK36 pKa = 9.83ICSTNVWTTRR46 pKa = 11.84AKK48 pKa = 10.78NKK50 pKa = 10.44LKK52 pKa = 10.63GRR54 pKa = 11.84SPWVYY59 pKa = 10.92
Molecular weight: 6.88 kDa
Isoelectric point according different methods:
Peptides (in silico digests for buttom-up proteomics)
Below you can find in silico digests of the whole proteome with Trypsin, Chymotrypsin, Trypsin+LysC, LysN, ArgC proteases suitable for different mass spec machines.| Try ESI |
 |
|---|
| ChTry ESI |
|
|---|
| ArgC ESI |
|
|---|
| LysN ESI |
|
|---|
| TryLysC ESI |
|
|---|
| Try MALDI |
|
|---|
| ChTry MALDI |
|
|---|
| ArgC MALDI |
|
|---|
| LysN MALDI |
|
|---|
| TryLysC MALDI |
|
|---|
| Try LTQ |
|
|---|
| ChTry LTQ |
|
|---|
| ArgC LTQ |
|
|---|
| LysN LTQ |
|
|---|
| TryLysC LTQ |
|
|---|
| Try MSlow |
|
|---|
| ChTry MSlow |
|
|---|
| ArgC MSlow |
|
|---|
| LysN MSlow |
|
|---|
| TryLysC MSlow |
|
|---|
| Try MShigh |
|
|---|
| ChTry MShigh |
|
|---|
| ArgC MShigh |
|
|---|
| LysN MShigh |
|
|---|
| TryLysC MShigh |
|
|---|
General Statistics
Number of major isoforms |
Number of additional isoforms |
Number of all proteins |
Number of amino acids |
Min. Seq. Length |
Max. Seq. Length |
Avg. Seq. Length |
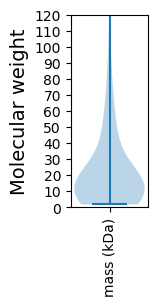
Avg. Mol. Weight |
|---|---|---|---|---|---|---|---|
0 |
41335 |
15 |
3404 |
227.1 |
25.46 |
Amino acid frequency
Ala |
Cys |
Asp |
Glu |
Phe |
Gly |
His |
Ile |
Lys |
Leu |
|---|---|---|---|---|---|---|---|---|---|
7.251 ± 0.276 | 1.176 ± 0.147 |
6.101 ± 0.137 | 6.759 ± 0.242 |
3.873 ± 0.191 | 6.063 ± 0.217 |
1.507 ± 0.145 | 6.176 ± 0.186 |
7.338 ± 0.342 | 9.263 ± 0.21 |
Met |
Asn |
Gln |
Pro |
Arg |
Ser |
Thr |
Val |
Trp |
Tyr |
|---|---|---|---|---|---|---|---|---|---|
1.805 ± 0.144 | 4.981 ± 0.148 |
4.151 ± 0.166 | 4.679 ± 0.325 |
4.65 ± 0.148 | 7.03 ± 0.223 |
6.249 ± 0.224 | 6.363 ± 0.151 |
1.103 ± 0.107 | 3.481 ± 0.204 |
Most of the basic statistics you can see at this page can be downloaded from this CSV file
See this proteome in:

Proteome-pI is available under Creative Commons Attribution-NoDerivs license, for more details see here
| Reference: Kozlowski LP. Proteome-pI 2.0: Proteome Isoelectric Point Database Update. Nucleic Acids Res. 2021, doi: 10.1093/nar/gkab944 | Contact: Lukasz P. Kozlowski |