Escherichia phage LAMP
Taxonomy: Viruses; Duplodnaviria; Heunggongvirae; Uroviricota; Caudoviricetes; Caudovirales; Podoviridae; Kuravirus; unclassified Kuravirus
Average proteome isoelectric point is 6.36
Get precalculated fractions of proteins
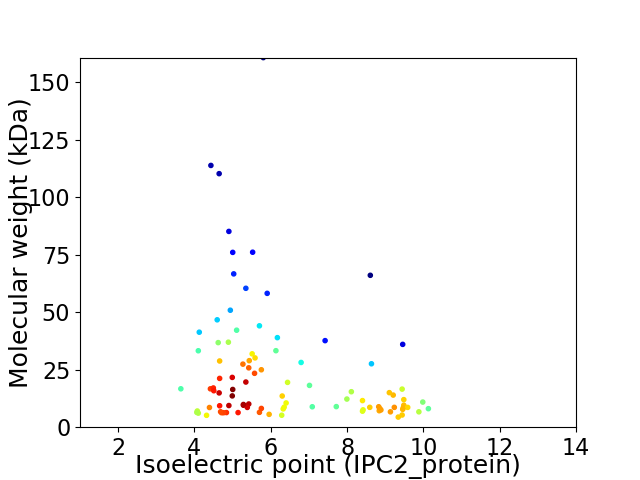
Virtual 2D-PAGE plot for 95 proteins (isoelectric point calculated using IPC2_protein)
Get csv file with sequences according to given criteria:
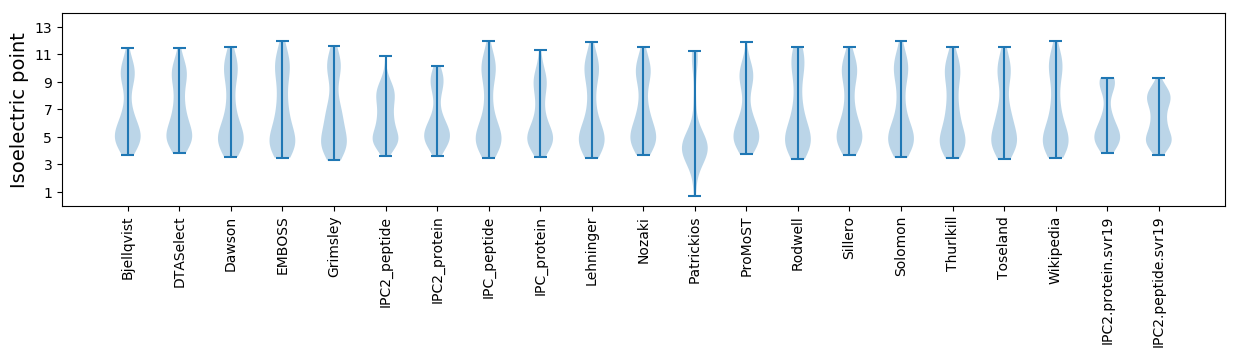
* You can choose from 21 different methods for calculating isoelectric point
Summary statistics related to proteome-wise predictions
Protein with the lowest isoelectric point:
>tr|A0A2I6PD12|A0A2I6PD12_9CAUD Uncharacterized protein OS=Escherichia phage LAMP OX=2065191 GN=phiL_039 PE=4 SV=1
MM1 pKa = 7.42INKK4 pKa = 9.58IKK6 pKa = 10.86DD7 pKa = 3.45NEE9 pKa = 4.13YY10 pKa = 10.85LLNSSILDD18 pKa = 3.53NGNTIDD24 pKa = 6.29FITLSEE30 pKa = 4.15LKK32 pKa = 10.55EE33 pKa = 4.19LVNSLYY39 pKa = 10.81SEE41 pKa = 4.11EE42 pKa = 4.1QNRR45 pKa = 11.84LLQEE49 pKa = 4.31SLSGDD54 pKa = 4.09YY55 pKa = 11.19VCDD58 pKa = 3.48GCLII62 pKa = 4.04
MM1 pKa = 7.42INKK4 pKa = 9.58IKK6 pKa = 10.86DD7 pKa = 3.45NEE9 pKa = 4.13YY10 pKa = 10.85LLNSSILDD18 pKa = 3.53NGNTIDD24 pKa = 6.29FITLSEE30 pKa = 4.15LKK32 pKa = 10.55EE33 pKa = 4.19LVNSLYY39 pKa = 10.81SEE41 pKa = 4.11EE42 pKa = 4.1QNRR45 pKa = 11.84LLQEE49 pKa = 4.31SLSGDD54 pKa = 4.09YY55 pKa = 11.19VCDD58 pKa = 3.48GCLII62 pKa = 4.04
Molecular weight: 7.04 kDa
Isoelectric point according different methods:
Protein with the highest isoelectric point:
>tr|A0A2I6PD32|A0A2I6PD32_9CAUD Uncharacterized protein OS=Escherichia phage LAMP OX=2065191 GN=phiL_070 PE=4 SV=1
MM1 pKa = 7.44SRR3 pKa = 11.84LHH5 pKa = 5.61STKK8 pKa = 10.26KK9 pKa = 10.3NNFYY13 pKa = 9.99RR14 pKa = 11.84QRR16 pKa = 11.84RR17 pKa = 11.84ARR19 pKa = 11.84SNASRR24 pKa = 11.84KK25 pKa = 8.17MKK27 pKa = 10.13GMQLTYY33 pKa = 10.77EE34 pKa = 4.14QIKK37 pKa = 9.94QINNIISQVVWEE49 pKa = 4.43VTVGEE54 pKa = 4.44PEE56 pKa = 3.65
MM1 pKa = 7.44SRR3 pKa = 11.84LHH5 pKa = 5.61STKK8 pKa = 10.26KK9 pKa = 10.3NNFYY13 pKa = 9.99RR14 pKa = 11.84QRR16 pKa = 11.84RR17 pKa = 11.84ARR19 pKa = 11.84SNASRR24 pKa = 11.84KK25 pKa = 8.17MKK27 pKa = 10.13GMQLTYY33 pKa = 10.77EE34 pKa = 4.14QIKK37 pKa = 9.94QINNIISQVVWEE49 pKa = 4.43VTVGEE54 pKa = 4.44PEE56 pKa = 3.65
Molecular weight: 6.68 kDa
Isoelectric point according different methods:
Peptides (in silico digests for buttom-up proteomics)
Below you can find in silico digests of the whole proteome with Trypsin, Chymotrypsin, Trypsin+LysC, LysN, ArgC proteases suitable for different mass spec machines.| Try ESI |
 |
|---|
| ChTry ESI |
|
|---|
| ArgC ESI |
|
|---|
| LysN ESI |
|
|---|
| TryLysC ESI |
|
|---|
| Try MALDI |
|
|---|
| ChTry MALDI |
|
|---|
| ArgC MALDI |
|
|---|
| LysN MALDI |
|
|---|
| TryLysC MALDI |
|
|---|
| Try LTQ |
|
|---|
| ChTry LTQ |
|
|---|
| ArgC LTQ |
|
|---|
| LysN LTQ |
|
|---|
| TryLysC LTQ |
|
|---|
| Try MSlow |
|
|---|
| ChTry MSlow |
|
|---|
| ArgC MSlow |
|
|---|
| LysN MSlow |
|
|---|
| TryLysC MSlow |
|
|---|
| Try MShigh |
|
|---|
| ChTry MShigh |
|
|---|
| ArgC MShigh |
|
|---|
| LysN MShigh |
|
|---|
| TryLysC MShigh |
|
|---|
General Statistics
Number of major isoforms |
Number of additional isoforms |
Number of all proteins |
Number of amino acids |
Min. Seq. Length |
Max. Seq. Length |
Avg. Seq. Length |
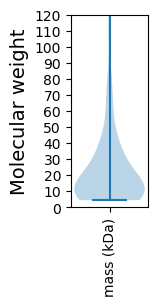
Avg. Mol. Weight |
|---|---|---|---|---|---|---|---|
0 |
20410 |
38 |
1450 |
214.8 |
24.02 |
Amino acid frequency
Ala |
Cys |
Asp |
Glu |
Phe |
Gly |
His |
Ile |
Lys |
Leu |
|---|---|---|---|---|---|---|---|---|---|
8.143 ± 0.534 | 1.068 ± 0.148 |
6.164 ± 0.28 | 7.075 ± 0.381 |
3.797 ± 0.158 | 7.134 ± 0.357 |
1.671 ± 0.145 | 5.806 ± 0.206 |
6.002 ± 0.338 | 7.202 ± 0.235 |
Met |
Asn |
Gln |
Pro |
Arg |
Ser |
Thr |
Val |
Trp |
Tyr |
|---|---|---|---|---|---|---|---|---|---|
2.685 ± 0.189 | 5.884 ± 0.253 |
3.704 ± 0.165 | 4.429 ± 0.318 |
5.365 ± 0.274 | 6.786 ± 0.231 |
5.698 ± 0.311 | 6.585 ± 0.28 |
1.372 ± 0.117 | 3.43 ± 0.167 |
Most of the basic statistics you can see at this page can be downloaded from this CSV file
See this proteome in:

Proteome-pI is available under Creative Commons Attribution-NoDerivs license, for more details see here
| Reference: Kozlowski LP. Proteome-pI 2.0: Proteome Isoelectric Point Database Update. Nucleic Acids Res. 2021, doi: 10.1093/nar/gkab944 | Contact: Lukasz P. Kozlowski |