Cellulophaga phage phi14:2
Taxonomy: Viruses; Duplodnaviria; Heunggongvirae; Uroviricota; Caudoviricetes; Caudovirales; Podoviridae; unclassified Podoviridae; crAss-like viruses
Average proteome isoelectric point is 6.64
Get precalculated fractions of proteins
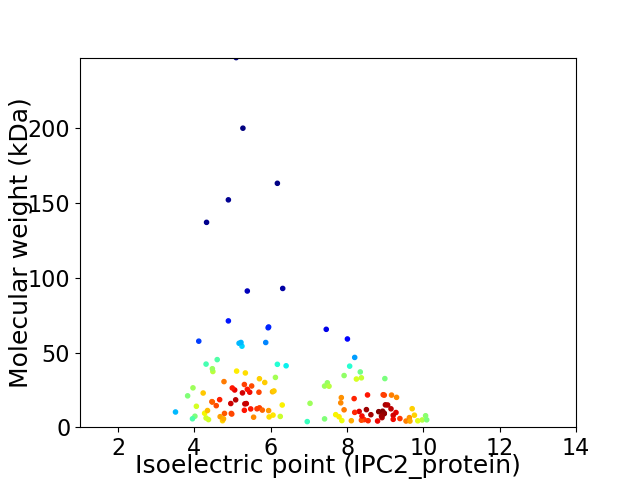
Virtual 2D-PAGE plot for 133 proteins (isoelectric point calculated using IPC2_protein)
Get csv file with sequences according to given criteria:
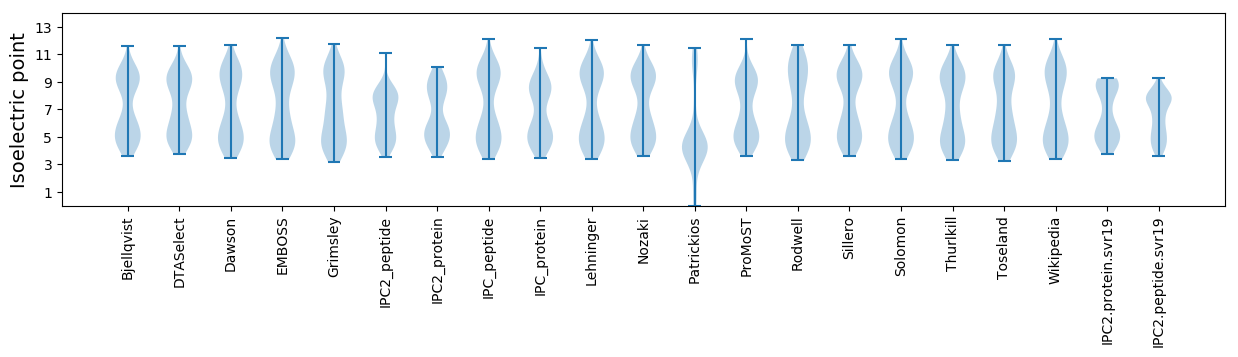
* You can choose from 21 different methods for calculating isoelectric point
Summary statistics related to proteome-wise predictions
Protein with the lowest isoelectric point:
>tr|S0A2D3|S0A2D3_9CAUD Uncharacterized protein OS=Cellulophaga phage phi14:2 OX=1327990 GN=Phi14:2_gp087 PE=4 SV=1
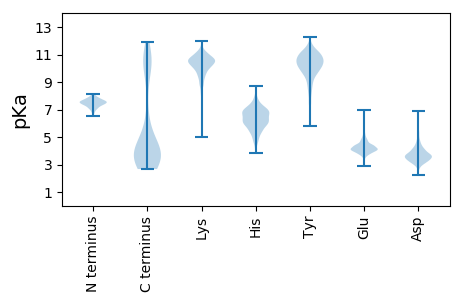
MM1 pKa = 7.31KK2 pKa = 10.11QPCPMCMGSKK12 pKa = 10.28EE13 pKa = 4.07IFTGSKK19 pKa = 10.31VEE21 pKa = 4.2TCNTCDD27 pKa = 4.15DD28 pKa = 5.03DD29 pKa = 6.18GNVTQEE35 pKa = 3.76FLDD38 pKa = 3.67IVEE41 pKa = 5.15HH42 pKa = 5.99NDD44 pKa = 3.11EE45 pKa = 4.46YY46 pKa = 11.4EE47 pKa = 4.11GDD49 pKa = 3.66FF50 pKa = 4.51
MM1 pKa = 7.31KK2 pKa = 10.11QPCPMCMGSKK12 pKa = 10.28EE13 pKa = 4.07IFTGSKK19 pKa = 10.31VEE21 pKa = 4.2TCNTCDD27 pKa = 4.15DD28 pKa = 5.03DD29 pKa = 6.18GNVTQEE35 pKa = 3.76FLDD38 pKa = 3.67IVEE41 pKa = 5.15HH42 pKa = 5.99NDD44 pKa = 3.11EE45 pKa = 4.46YY46 pKa = 11.4EE47 pKa = 4.11GDD49 pKa = 3.66FF50 pKa = 4.51
Molecular weight: 5.65 kDa
Isoelectric point according different methods:
Protein with the highest isoelectric point:
>tr|S0A375|S0A375_9CAUD Uncharacterized protein OS=Cellulophaga phage phi14:2 OX=1327990 GN=Phi14:2_gp019 PE=4 SV=1
MM1 pKa = 6.63THH3 pKa = 6.11WRR5 pKa = 11.84DD6 pKa = 3.4SGVGGIRR13 pKa = 11.84TPVTQIKK20 pKa = 10.27LIIILYY26 pKa = 9.82SFTFVYY32 pKa = 9.71TLYY35 pKa = 11.13ARR37 pKa = 11.84FIIKK41 pKa = 10.05KK42 pKa = 9.79
MM1 pKa = 6.63THH3 pKa = 6.11WRR5 pKa = 11.84DD6 pKa = 3.4SGVGGIRR13 pKa = 11.84TPVTQIKK20 pKa = 10.27LIIILYY26 pKa = 9.82SFTFVYY32 pKa = 9.71TLYY35 pKa = 11.13ARR37 pKa = 11.84FIIKK41 pKa = 10.05KK42 pKa = 9.79
Molecular weight: 4.95 kDa
Isoelectric point according different methods:
Peptides (in silico digests for buttom-up proteomics)
Below you can find in silico digests of the whole proteome with Trypsin, Chymotrypsin, Trypsin+LysC, LysN, ArgC proteases suitable for different mass spec machines.| Try ESI |
 |
|---|
| ChTry ESI |
|
|---|
| ArgC ESI |
|
|---|
| LysN ESI |
|
|---|
| TryLysC ESI |
|
|---|
| Try MALDI |
|
|---|
| ChTry MALDI |
|
|---|
| ArgC MALDI |
|
|---|
| LysN MALDI |
|
|---|
| TryLysC MALDI |
|
|---|
| Try LTQ |
|
|---|
| ChTry LTQ |
|
|---|
| ArgC LTQ |
|
|---|
| LysN LTQ |
|
|---|
| TryLysC LTQ |
|
|---|
| Try MSlow |
|
|---|
| ChTry MSlow |
|
|---|
| ArgC MSlow |
|
|---|
| LysN MSlow |
|
|---|
| TryLysC MSlow |
|
|---|
| Try MShigh |
|
|---|
| ChTry MShigh |
|
|---|
| ArgC MShigh |
|
|---|
| LysN MShigh |
|
|---|
| TryLysC MShigh |
|
|---|
General Statistics
Number of major isoforms |
Number of additional isoforms |
Number of all proteins |
Number of amino acids |
Min. Seq. Length |
Max. Seq. Length |
Avg. Seq. Length |
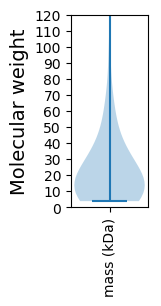
Avg. Mol. Weight |
|---|---|---|---|---|---|---|---|
0 |
31995 |
33 |
2180 |
240.6 |
27.4 |
Amino acid frequency
Ala |
Cys |
Asp |
Glu |
Phe |
Gly |
His |
Ile |
Lys |
Leu |
|---|---|---|---|---|---|---|---|---|---|
4.588 ± 0.19 | 0.85 ± 0.117 |
6.623 ± 0.12 | 7.064 ± 0.257 |
4.607 ± 0.12 | 5.798 ± 0.272 |
1.513 ± 0.09 | 8.051 ± 0.221 |
8.664 ± 0.334 | 8.192 ± 0.22 |
Met |
Asn |
Gln |
Pro |
Arg |
Ser |
Thr |
Val |
Trp |
Tyr |
|---|---|---|---|---|---|---|---|---|---|
2.088 ± 0.119 | 7.554 ± 0.199 |
2.91 ± 0.116 | 3.104 ± 0.145 |
3.691 ± 0.168 | 7.457 ± 0.238 |
6.354 ± 0.274 | 5.516 ± 0.161 |
0.913 ± 0.072 | 4.463 ± 0.182 |
Most of the basic statistics you can see at this page can be downloaded from this CSV file
See this proteome in:

Proteome-pI is available under Creative Commons Attribution-NoDerivs license, for more details see here
| Reference: Kozlowski LP. Proteome-pI 2.0: Proteome Isoelectric Point Database Update. Nucleic Acids Res. 2021, doi: 10.1093/nar/gkab944 | Contact: Lukasz P. Kozlowski |