Lachnospira multipara
Taxonomy: cellular organisms; Bacteria; Terrabacteria group; Firmicutes; Clostridia; Eubacteriales; Lachnospiraceae; Lachnospira
Average proteome isoelectric point is 5.91
Get precalculated fractions of proteins
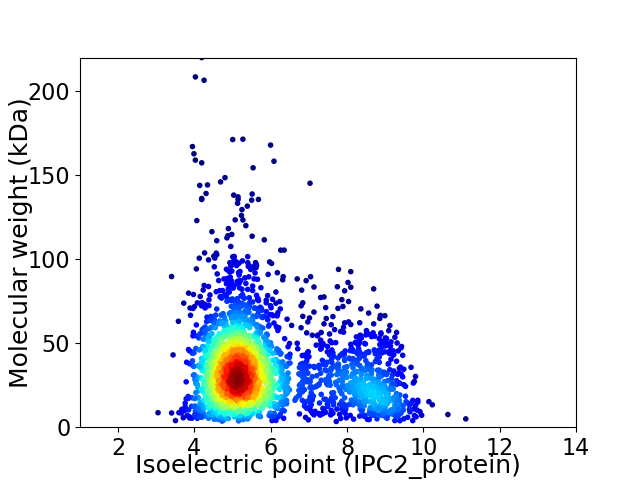
Virtual 2D-PAGE plot for 2518 proteins (isoelectric point calculated using IPC2_protein)
Get csv file with sequences according to given criteria:
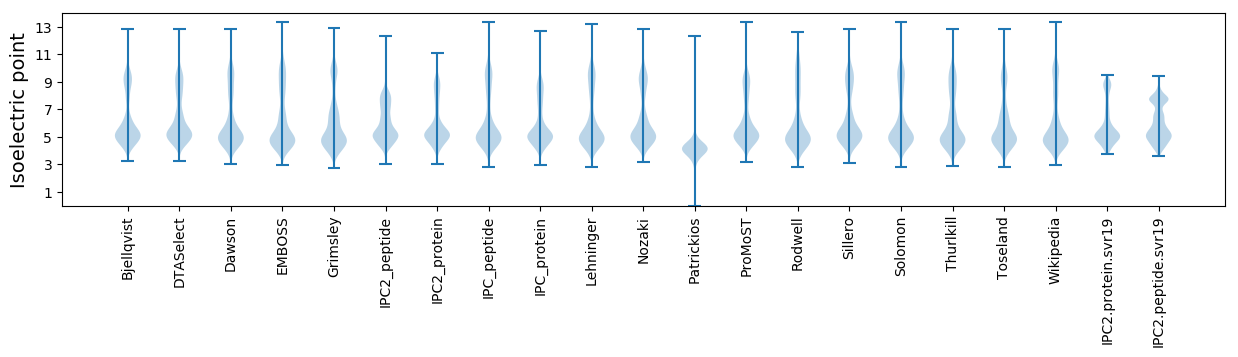
* You can choose from 21 different methods for calculating isoelectric point
Summary statistics related to proteome-wise predictions
Protein with the lowest isoelectric point:
>tr|A0A1H5RPT9|A0A1H5RPT9_9FIRM Ribosomal protein S12 methylthiotransferase RimO OS=Lachnospira multipara OX=28051 GN=rimO PE=3 SV=1
MM1 pKa = 7.41SGIYY5 pKa = 9.96GVEE8 pKa = 3.76ALDD11 pKa = 3.71GNIYY15 pKa = 7.8QVKK18 pKa = 9.92YY19 pKa = 10.79SNDD22 pKa = 3.64SNSVTGDD29 pKa = 3.05SFDD32 pKa = 3.86TVFSEE37 pKa = 4.09INAPVDD43 pKa = 3.55LEE45 pKa = 4.95SIFSEE50 pKa = 4.13AASKK54 pKa = 11.3YY55 pKa = 9.81GVNEE59 pKa = 3.95NLLKK63 pKa = 10.7AVAYY67 pKa = 10.2AEE69 pKa = 4.72SGFDD73 pKa = 3.53TNATSSAGAQGIMQLMPYY91 pKa = 9.34VAEE94 pKa = 4.65DD95 pKa = 3.67LGVTDD100 pKa = 5.56PYY102 pKa = 11.25NAEE105 pKa = 3.91QNINAGASLLSSLLSKK121 pKa = 11.36YY122 pKa = 10.18NGNVTLSLAAYY133 pKa = 8.93NAGSGNVSKK142 pKa = 11.43YY143 pKa = 10.83NGVPPFKK150 pKa = 9.91EE151 pKa = 4.12TQNYY155 pKa = 7.83IAKK158 pKa = 10.31INDD161 pKa = 4.01LLGGALSGDD170 pKa = 3.71STTLDD175 pKa = 4.38GISPATVIEE184 pKa = 4.21EE185 pKa = 4.28SLVDD189 pKa = 3.59IPSTKK194 pKa = 9.61IYY196 pKa = 10.79SNSNSQTNEE205 pKa = 3.11EE206 pKa = 4.18STQLNTNANAISNSAYY222 pKa = 9.52LTVANNEE229 pKa = 4.16KK230 pKa = 10.63LLEE233 pKa = 4.08LLKK236 pKa = 11.09ALANSGSNSSTYY248 pKa = 10.12KK249 pKa = 10.69DD250 pKa = 3.55SVMLDD255 pKa = 3.72LVSLITGNYY264 pKa = 10.28DD265 pKa = 3.07SDD267 pKa = 4.14EE268 pKa = 4.35DD269 pKa = 4.16SKK271 pKa = 12.01DD272 pKa = 4.03LISSLYY278 pKa = 8.97TNSATSTVSDD288 pKa = 3.68SDD290 pKa = 3.6EE291 pKa = 4.54SLLSSYY297 pKa = 10.76LSSLSTDD304 pKa = 3.46EE305 pKa = 5.97LDD307 pKa = 4.19ALSKK311 pKa = 10.87NSQLQEE317 pKa = 4.03DD318 pKa = 4.72FGLSSEE324 pKa = 4.32ALALTSKK331 pKa = 10.92LNNQANNILEE341 pKa = 4.22TDD343 pKa = 4.18LYY345 pKa = 11.24SLYY348 pKa = 10.06EE349 pKa = 4.18AQSSVMSPVLAKK361 pKa = 10.68LLNLL365 pKa = 4.1
MM1 pKa = 7.41SGIYY5 pKa = 9.96GVEE8 pKa = 3.76ALDD11 pKa = 3.71GNIYY15 pKa = 7.8QVKK18 pKa = 9.92YY19 pKa = 10.79SNDD22 pKa = 3.64SNSVTGDD29 pKa = 3.05SFDD32 pKa = 3.86TVFSEE37 pKa = 4.09INAPVDD43 pKa = 3.55LEE45 pKa = 4.95SIFSEE50 pKa = 4.13AASKK54 pKa = 11.3YY55 pKa = 9.81GVNEE59 pKa = 3.95NLLKK63 pKa = 10.7AVAYY67 pKa = 10.2AEE69 pKa = 4.72SGFDD73 pKa = 3.53TNATSSAGAQGIMQLMPYY91 pKa = 9.34VAEE94 pKa = 4.65DD95 pKa = 3.67LGVTDD100 pKa = 5.56PYY102 pKa = 11.25NAEE105 pKa = 3.91QNINAGASLLSSLLSKK121 pKa = 11.36YY122 pKa = 10.18NGNVTLSLAAYY133 pKa = 8.93NAGSGNVSKK142 pKa = 11.43YY143 pKa = 10.83NGVPPFKK150 pKa = 9.91EE151 pKa = 4.12TQNYY155 pKa = 7.83IAKK158 pKa = 10.31INDD161 pKa = 4.01LLGGALSGDD170 pKa = 3.71STTLDD175 pKa = 4.38GISPATVIEE184 pKa = 4.21EE185 pKa = 4.28SLVDD189 pKa = 3.59IPSTKK194 pKa = 9.61IYY196 pKa = 10.79SNSNSQTNEE205 pKa = 3.11EE206 pKa = 4.18STQLNTNANAISNSAYY222 pKa = 9.52LTVANNEE229 pKa = 4.16KK230 pKa = 10.63LLEE233 pKa = 4.08LLKK236 pKa = 11.09ALANSGSNSSTYY248 pKa = 10.12KK249 pKa = 10.69DD250 pKa = 3.55SVMLDD255 pKa = 3.72LVSLITGNYY264 pKa = 10.28DD265 pKa = 3.07SDD267 pKa = 4.14EE268 pKa = 4.35DD269 pKa = 4.16SKK271 pKa = 12.01DD272 pKa = 4.03LISSLYY278 pKa = 8.97TNSATSTVSDD288 pKa = 3.68SDD290 pKa = 3.6EE291 pKa = 4.54SLLSSYY297 pKa = 10.76LSSLSTDD304 pKa = 3.46EE305 pKa = 5.97LDD307 pKa = 4.19ALSKK311 pKa = 10.87NSQLQEE317 pKa = 4.03DD318 pKa = 4.72FGLSSEE324 pKa = 4.32ALALTSKK331 pKa = 10.92LNNQANNILEE341 pKa = 4.22TDD343 pKa = 4.18LYY345 pKa = 11.24SLYY348 pKa = 10.06EE349 pKa = 4.18AQSSVMSPVLAKK361 pKa = 10.68LLNLL365 pKa = 4.1
Molecular weight: 38.6 kDa
Isoelectric point according different methods:
Protein with the highest isoelectric point:
>tr|A0A1H5U848|A0A1H5U848_9FIRM Energy-coupling factor transport system ATP-binding protein OS=Lachnospira multipara OX=28051 GN=SAMN05216537_106107 PE=4 SV=1
MM1 pKa = 7.67KK2 pKa = 8.71MTFQPKK8 pKa = 7.43TRR10 pKa = 11.84QRR12 pKa = 11.84AKK14 pKa = 9.26VHH16 pKa = 5.59GFRR19 pKa = 11.84ARR21 pKa = 11.84MSSAGGRR28 pKa = 11.84KK29 pKa = 8.81VLAARR34 pKa = 11.84RR35 pKa = 11.84AKK37 pKa = 10.05GRR39 pKa = 11.84KK40 pKa = 8.61NLSAA44 pKa = 4.67
MM1 pKa = 7.67KK2 pKa = 8.71MTFQPKK8 pKa = 7.43TRR10 pKa = 11.84QRR12 pKa = 11.84AKK14 pKa = 9.26VHH16 pKa = 5.59GFRR19 pKa = 11.84ARR21 pKa = 11.84MSSAGGRR28 pKa = 11.84KK29 pKa = 8.81VLAARR34 pKa = 11.84RR35 pKa = 11.84AKK37 pKa = 10.05GRR39 pKa = 11.84KK40 pKa = 8.61NLSAA44 pKa = 4.67
Molecular weight: 4.94 kDa
Isoelectric point according different methods:
Peptides (in silico digests for buttom-up proteomics)
Below you can find in silico digests of the whole proteome with Trypsin, Chymotrypsin, Trypsin+LysC, LysN, ArgC proteases suitable for different mass spec machines.| Try ESI |
 |
|---|
| ChTry ESI |
|
|---|
| ArgC ESI |
|
|---|
| LysN ESI |
|
|---|
| TryLysC ESI |
|
|---|
| Try MALDI |
|
|---|
| ChTry MALDI |
|
|---|
| ArgC MALDI |
|
|---|
| LysN MALDI |
|
|---|
| TryLysC MALDI |
|
|---|
| Try LTQ |
|
|---|
| ChTry LTQ |
|
|---|
| ArgC LTQ |
|
|---|
| LysN LTQ |
|
|---|
| TryLysC LTQ |
|
|---|
| Try MSlow |
|
|---|
| ChTry MSlow |
|
|---|
| ArgC MSlow |
|
|---|
| LysN MSlow |
|
|---|
| TryLysC MSlow |
|
|---|
| Try MShigh |
|
|---|
| ChTry MShigh |
|
|---|
| ArgC MShigh |
|
|---|
| LysN MShigh |
|
|---|
| TryLysC MShigh |
|
|---|
General Statistics
Number of major isoforms |
Number of additional isoforms |
Number of all proteins |
Number of amino acids |
Min. Seq. Length |
Max. Seq. Length |
Avg. Seq. Length |
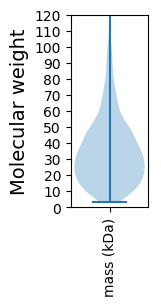
Avg. Mol. Weight |
|---|---|---|---|---|---|---|---|
0 |
824386 |
32 |
2035 |
327.4 |
36.79 |
Amino acid frequency
Ala |
Cys |
Asp |
Glu |
Phe |
Gly |
His |
Ile |
Lys |
Leu |
|---|---|---|---|---|---|---|---|---|---|
6.897 ± 0.05 | 1.286 ± 0.018 |
6.303 ± 0.038 | 7.474 ± 0.056 |
4.238 ± 0.038 | 6.278 ± 0.049 |
1.413 ± 0.018 | 8.284 ± 0.055 |
7.854 ± 0.047 | 8.777 ± 0.056 |
Met |
Asn |
Gln |
Pro |
Arg |
Ser |
Thr |
Val |
Trp |
Tyr |
|---|---|---|---|---|---|---|---|---|---|
2.665 ± 0.025 | 5.751 ± 0.039 |
2.653 ± 0.028 | 2.352 ± 0.027 |
3.592 ± 0.033 | 6.568 ± 0.054 |
5.565 ± 0.052 | 6.849 ± 0.044 |
0.705 ± 0.015 | 4.496 ± 0.035 |
Most of the basic statistics you can see at this page can be downloaded from this CSV file
See this proteome in:

Proteome-pI is available under Creative Commons Attribution-NoDerivs license, for more details see here
| Reference: Kozlowski LP. Proteome-pI 2.0: Proteome Isoelectric Point Database Update. Nucleic Acids Res. 2021, doi: 10.1093/nar/gkab944 | Contact: Lukasz P. Kozlowski |