Clostridium phage phiCD111
Taxonomy: Viruses; Duplodnaviria; Heunggongvirae; Uroviricota; Caudoviricetes; Caudovirales; Siphoviridae; Leicestervirus; Clostridioides virus phiCD111
Average proteome isoelectric point is 6.36
Get precalculated fractions of proteins
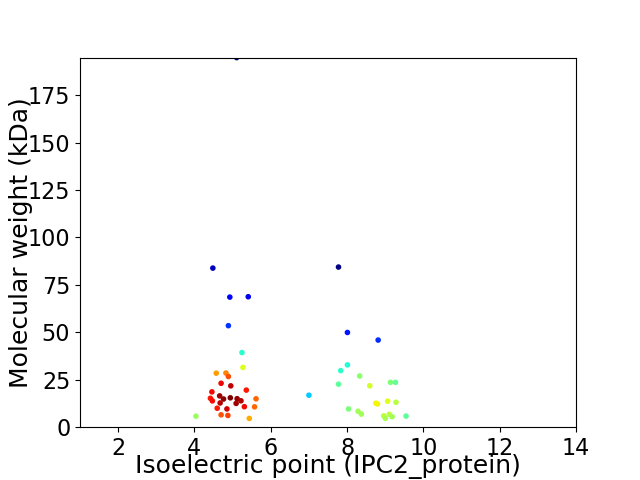
Virtual 2D-PAGE plot for 55 proteins (isoelectric point calculated using IPC2_protein)
Get csv file with sequences according to given criteria:
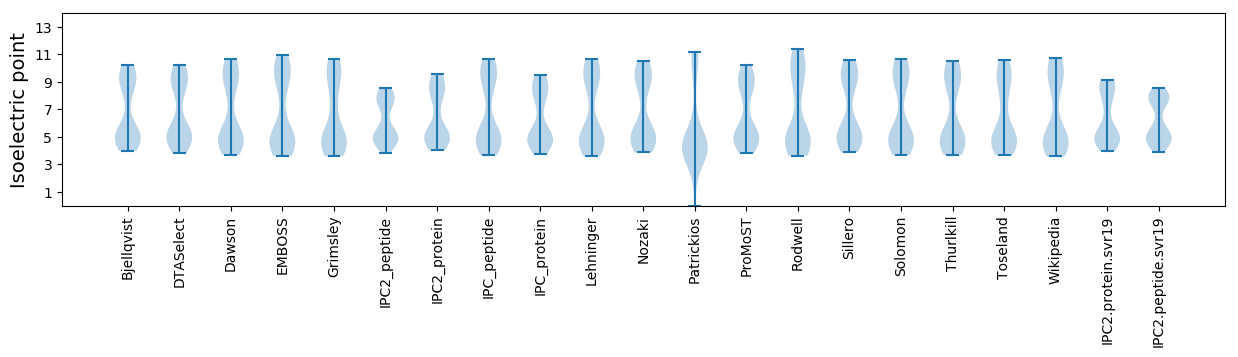
* You can choose from 21 different methods for calculating isoelectric point
Summary statistics related to proteome-wise predictions
Protein with the lowest isoelectric point:
>tr|A0A0A8WIK0|A0A0A8WIK0_9CAUD Uncharacterized protein OS=Clostridium phage phiCD111 OX=1582150 GN=PHICD111_20048 PE=4 SV=1
MM1 pKa = 7.64SEE3 pKa = 5.36FVQCCCCEE11 pKa = 3.56RR12 pKa = 11.84TINIEE17 pKa = 3.74EE18 pKa = 4.15NNYY21 pKa = 8.78VQYY24 pKa = 10.76EE25 pKa = 4.18KK26 pKa = 10.84EE27 pKa = 3.89ALGLVFTLYY36 pKa = 10.73FCLNCVDD43 pKa = 4.63EE44 pKa = 4.67LSEE47 pKa = 4.15MEE49 pKa = 4.11
MM1 pKa = 7.64SEE3 pKa = 5.36FVQCCCCEE11 pKa = 3.56RR12 pKa = 11.84TINIEE17 pKa = 3.74EE18 pKa = 4.15NNYY21 pKa = 8.78VQYY24 pKa = 10.76EE25 pKa = 4.18KK26 pKa = 10.84EE27 pKa = 3.89ALGLVFTLYY36 pKa = 10.73FCLNCVDD43 pKa = 4.63EE44 pKa = 4.67LSEE47 pKa = 4.15MEE49 pKa = 4.11
Molecular weight: 5.8 kDa
Isoelectric point according different methods:
Protein with the highest isoelectric point:
>tr|A0A0A8WIJ6|A0A0A8WIJ6_9CAUD Uncharacterized protein OS=Clostridium phage phiCD111 OX=1582150 GN=PHICD111_20038 PE=4 SV=1
MM1 pKa = 8.26DD2 pKa = 4.88NFLLNILAGVIASLIFYY19 pKa = 9.98IISKK23 pKa = 9.74LFRR26 pKa = 11.84QVKK29 pKa = 8.87NHH31 pKa = 5.97SAQKK35 pKa = 10.51SGWEE39 pKa = 3.7FDD41 pKa = 4.05LKK43 pKa = 10.85IKK45 pKa = 10.36FKK47 pKa = 10.76KK48 pKa = 10.25SRR50 pKa = 3.35
MM1 pKa = 8.26DD2 pKa = 4.88NFLLNILAGVIASLIFYY19 pKa = 9.98IISKK23 pKa = 9.74LFRR26 pKa = 11.84QVKK29 pKa = 8.87NHH31 pKa = 5.97SAQKK35 pKa = 10.51SGWEE39 pKa = 3.7FDD41 pKa = 4.05LKK43 pKa = 10.85IKK45 pKa = 10.36FKK47 pKa = 10.76KK48 pKa = 10.25SRR50 pKa = 3.35
Molecular weight: 5.86 kDa
Isoelectric point according different methods:
Peptides (in silico digests for buttom-up proteomics)
Below you can find in silico digests of the whole proteome with Trypsin, Chymotrypsin, Trypsin+LysC, LysN, ArgC proteases suitable for different mass spec machines.| Try ESI |
 |
|---|
| ChTry ESI |
|
|---|
| ArgC ESI |
|
|---|
| LysN ESI |
|
|---|
| TryLysC ESI |
|
|---|
| Try MALDI |
|
|---|
| ChTry MALDI |
|
|---|
| ArgC MALDI |
|
|---|
| LysN MALDI |
|
|---|
| TryLysC MALDI |
|
|---|
| Try LTQ |
|
|---|
| ChTry LTQ |
|
|---|
| ArgC LTQ |
|
|---|
| LysN LTQ |
|
|---|
| TryLysC LTQ |
|
|---|
| Try MSlow |
|
|---|
| ChTry MSlow |
|
|---|
| ArgC MSlow |
|
|---|
| LysN MSlow |
|
|---|
| TryLysC MSlow |
|
|---|
| Try MShigh |
|
|---|
| ChTry MShigh |
|
|---|
| ArgC MShigh |
|
|---|
| LysN MShigh |
|
|---|
| TryLysC MShigh |
|
|---|
General Statistics
Number of major isoforms |
Number of additional isoforms |
Number of all proteins |
Number of amino acids |
Min. Seq. Length |
Max. Seq. Length |
Avg. Seq. Length |
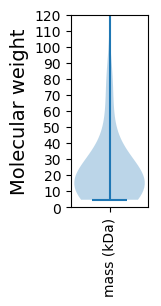
Avg. Mol. Weight |
|---|---|---|---|---|---|---|---|
0 |
12303 |
39 |
1767 |
223.7 |
25.47 |
Amino acid frequency
Ala |
Cys |
Asp |
Glu |
Phe |
Gly |
His |
Ile |
Lys |
Leu |
|---|---|---|---|---|---|---|---|---|---|
5.608 ± 0.394 | 0.983 ± 0.163 |
5.934 ± 0.249 | 8.884 ± 0.403 |
4.349 ± 0.29 | 5.934 ± 0.463 |
0.918 ± 0.154 | 9.063 ± 0.315 |
10.087 ± 0.404 | 7.957 ± 0.294 |
Met |
Asn |
Gln |
Pro |
Arg |
Ser |
Thr |
Val |
Trp |
Tyr |
|---|---|---|---|---|---|---|---|---|---|
2.154 ± 0.174 | 7.307 ± 0.339 |
1.796 ± 0.15 | 2.991 ± 0.22 |
3.316 ± 0.294 | 6.429 ± 0.289 |
5.722 ± 0.388 | 5.527 ± 0.219 |
0.983 ± 0.121 | 4.056 ± 0.43 |
Most of the basic statistics you can see at this page can be downloaded from this CSV file
See this proteome in:

Proteome-pI is available under Creative Commons Attribution-NoDerivs license, for more details see here
| Reference: Kozlowski LP. Proteome-pI 2.0: Proteome Isoelectric Point Database Update. Nucleic Acids Res. 2021, doi: 10.1093/nar/gkab944 | Contact: Lukasz P. Kozlowski |