Escherichia phage Bp4
Taxonomy: Viruses; Duplodnaviria; Heunggongvirae; Uroviricota; Caudoviricetes; Caudovirales; Schitoviridae; Enquatrovirinae; Gamaleyavirus; Escherichia virus Bp4
Average proteome isoelectric point is 6.47
Get precalculated fractions of proteins
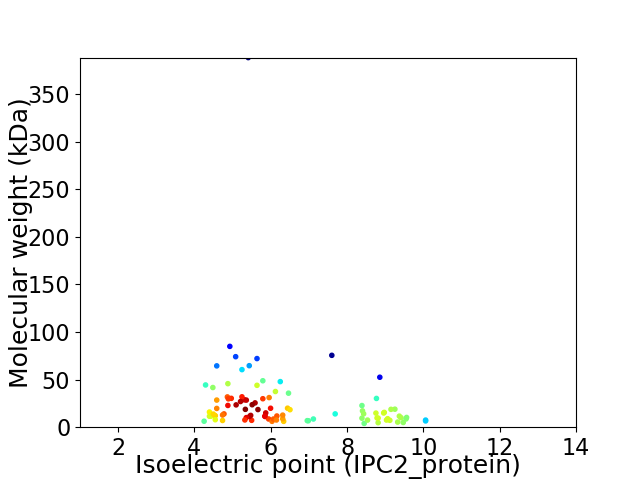
Virtual 2D-PAGE plot for 94 proteins (isoelectric point calculated using IPC2_protein)
Get csv file with sequences according to given criteria:
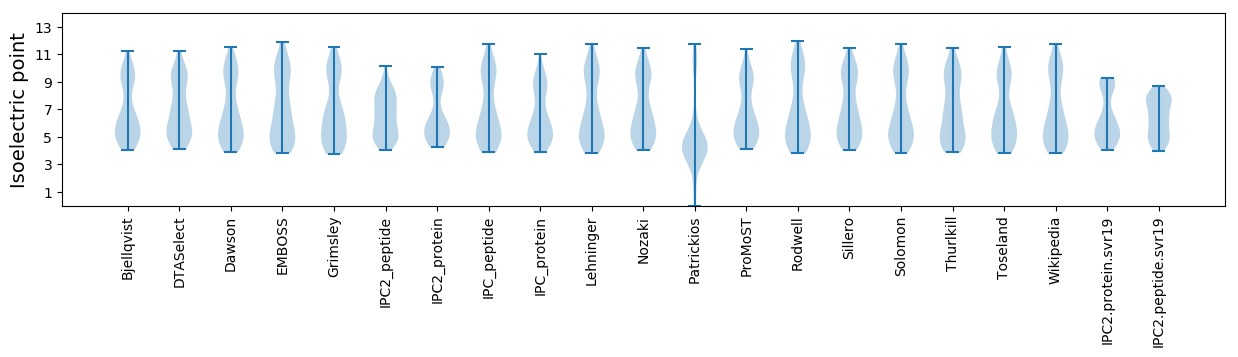
* You can choose from 21 different methods for calculating isoelectric point
Summary statistics related to proteome-wise predictions
Protein with the lowest isoelectric point:
>tr|X2KMH7|X2KMH7_9CAUD Uncharacterized protein OS=Escherichia phage Bp4 OX=1458848 GN=EpBp4_0008 PE=4 SV=1
MM1 pKa = 7.53LGVPITFIKK10 pKa = 10.02IDD12 pKa = 3.5TSIEE16 pKa = 3.9VPEE19 pKa = 4.09NVVVYY24 pKa = 9.81IYY26 pKa = 10.51SSCEE30 pKa = 3.66PMVVTTLTGRR40 pKa = 11.84LITLYY45 pKa = 10.11PSTSYY50 pKa = 11.06LSSDD54 pKa = 3.71EE55 pKa = 4.32SCC57 pKa = 3.97
MM1 pKa = 7.53LGVPITFIKK10 pKa = 10.02IDD12 pKa = 3.5TSIEE16 pKa = 3.9VPEE19 pKa = 4.09NVVVYY24 pKa = 9.81IYY26 pKa = 10.51SSCEE30 pKa = 3.66PMVVTTLTGRR40 pKa = 11.84LITLYY45 pKa = 10.11PSTSYY50 pKa = 11.06LSSDD54 pKa = 3.71EE55 pKa = 4.32SCC57 pKa = 3.97
Molecular weight: 6.28 kDa
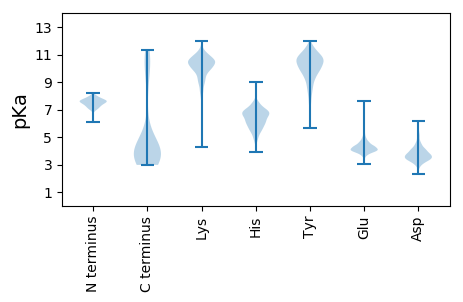
Isoelectric point according different methods:
Protein with the highest isoelectric point:
>tr|A0A0A7X6Y9|A0A0A7X6Y9_9CAUD Uncharacterized protein OS=Escherichia phage Bp4 OX=1458848 GN=EpBp4_0090 PE=4 SV=1
MM1 pKa = 7.56EE2 pKa = 5.01SLAAILVMLFILAVYY17 pKa = 8.21LIPTIIAFARR27 pKa = 11.84GHH29 pKa = 5.64ASKK32 pKa = 10.1WGIGVLNIVLGWSLVFWVVALIWSLSNKK60 pKa = 9.07GRR62 pKa = 11.84TRR64 pKa = 11.84LQMM67 pKa = 4.05
MM1 pKa = 7.56EE2 pKa = 5.01SLAAILVMLFILAVYY17 pKa = 8.21LIPTIIAFARR27 pKa = 11.84GHH29 pKa = 5.64ASKK32 pKa = 10.1WGIGVLNIVLGWSLVFWVVALIWSLSNKK60 pKa = 9.07GRR62 pKa = 11.84TRR64 pKa = 11.84LQMM67 pKa = 4.05
Molecular weight: 7.47 kDa
Isoelectric point according different methods:
Peptides (in silico digests for buttom-up proteomics)
Below you can find in silico digests of the whole proteome with Trypsin, Chymotrypsin, Trypsin+LysC, LysN, ArgC proteases suitable for different mass spec machines.| Try ESI |
 |
|---|
| ChTry ESI |
|
|---|
| ArgC ESI |
|
|---|
| LysN ESI |
|
|---|
| TryLysC ESI |
|
|---|
| Try MALDI |
|
|---|
| ChTry MALDI |
|
|---|
| ArgC MALDI |
|
|---|
| LysN MALDI |
|
|---|
| TryLysC MALDI |
|
|---|
| Try LTQ |
|
|---|
| ChTry LTQ |
|
|---|
| ArgC LTQ |
|
|---|
| LysN LTQ |
|
|---|
| TryLysC LTQ |
|
|---|
| Try MSlow |
|
|---|
| ChTry MSlow |
|
|---|
| ArgC MSlow |
|
|---|
| LysN MSlow |
|
|---|
| TryLysC MSlow |
|
|---|
| Try MShigh |
|
|---|
| ChTry MShigh |
|
|---|
| ArgC MShigh |
|
|---|
| LysN MShigh |
|
|---|
| TryLysC MShigh |
|
|---|
General Statistics
Number of major isoforms |
Number of additional isoforms |
Number of all proteins |
Number of amino acids |
Min. Seq. Length |
Max. Seq. Length |
Avg. Seq. Length |
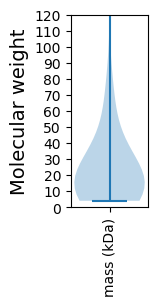
Avg. Mol. Weight |
|---|---|---|---|---|---|---|---|
0 |
21673 |
34 |
3570 |
230.6 |
25.63 |
Amino acid frequency
Ala |
Cys |
Asp |
Glu |
Phe |
Gly |
His |
Ile |
Lys |
Leu |
|---|---|---|---|---|---|---|---|---|---|
8.637 ± 0.579 | 0.895 ± 0.17 |
5.657 ± 0.183 | 6.34 ± 0.278 |
3.613 ± 0.175 | 6.778 ± 0.267 |
1.776 ± 0.168 | 5.772 ± 0.238 |
6.367 ± 0.267 | 8.365 ± 0.196 |
Met |
Asn |
Gln |
Pro |
Arg |
Ser |
Thr |
Val |
Trp |
Tyr |
|---|---|---|---|---|---|---|---|---|---|
2.953 ± 0.119 | 5.717 ± 0.164 |
4.093 ± 0.158 | 4.305 ± 0.261 |
4.328 ± 0.164 | 6.178 ± 0.213 |
6.437 ± 0.278 | 7.009 ± 0.209 |
1.19 ± 0.118 | 3.59 ± 0.231 |
Most of the basic statistics you can see at this page can be downloaded from this CSV file
See this proteome in:

Proteome-pI is available under Creative Commons Attribution-NoDerivs license, for more details see here
| Reference: Kozlowski LP. Proteome-pI 2.0: Proteome Isoelectric Point Database Update. Nucleic Acids Res. 2021, doi: 10.1093/nar/gkab944 | Contact: Lukasz P. Kozlowski |