Pseudomonas phage KPP21
Taxonomy: Viruses; Duplodnaviria; Heunggongvirae; Uroviricota; Caudoviricetes; Caudovirales; Schitoviridae; Migulavirinae; Luzseptimavirus; Pseudomonas virus KPP21
Average proteome isoelectric point is 6.56
Get precalculated fractions of proteins
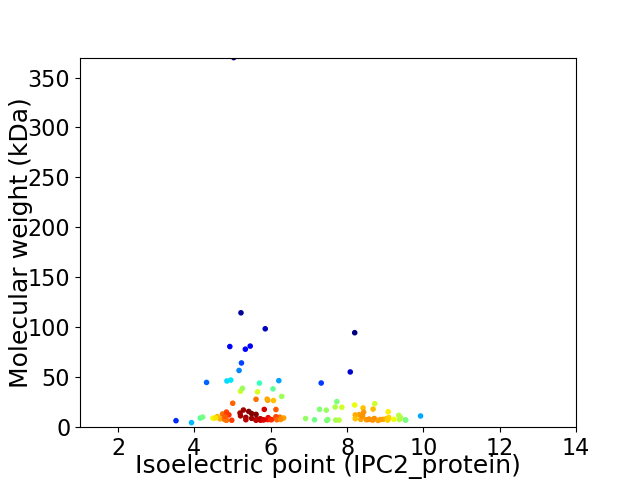
Virtual 2D-PAGE plot for 113 proteins (isoelectric point calculated using IPC2_protein)
Get csv file with sequences according to given criteria:
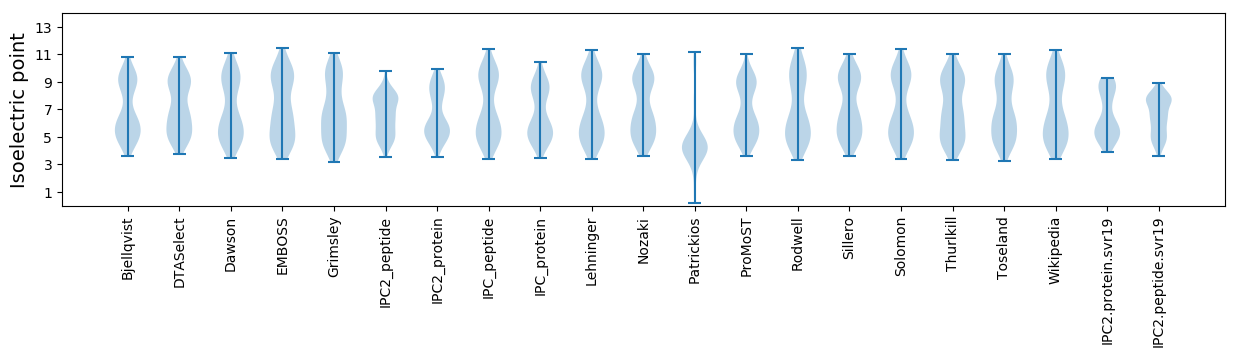
* You can choose from 21 different methods for calculating isoelectric point
Summary statistics related to proteome-wise predictions
Protein with the lowest isoelectric point:
>tr|A0A0H5AXU9|A0A0H5AXU9_BPK21 Uncharacterized protein OS=Pseudomonas phage KPP21 OX=1678082 PE=4 SV=1
MM1 pKa = 7.8AEE3 pKa = 4.52DD4 pKa = 3.87DD5 pKa = 4.15TVEE8 pKa = 4.16EE9 pKa = 4.16AWLLLWSLHH18 pKa = 6.73DD19 pKa = 4.35KK20 pKa = 8.4YY21 pKa = 9.62TKK23 pKa = 10.46EE24 pKa = 4.05GLSNPNLQLGDD35 pKa = 4.19LDD37 pKa = 5.48DD38 pKa = 4.73GPFYY42 pKa = 10.93EE43 pKa = 6.02DD44 pKa = 3.44YY45 pKa = 11.38DD46 pKa = 4.03EE47 pKa = 4.64GTEE50 pKa = 4.16EE51 pKa = 4.33PACSGDD57 pKa = 3.24AA58 pKa = 3.71
MM1 pKa = 7.8AEE3 pKa = 4.52DD4 pKa = 3.87DD5 pKa = 4.15TVEE8 pKa = 4.16EE9 pKa = 4.16AWLLLWSLHH18 pKa = 6.73DD19 pKa = 4.35KK20 pKa = 8.4YY21 pKa = 9.62TKK23 pKa = 10.46EE24 pKa = 4.05GLSNPNLQLGDD35 pKa = 4.19LDD37 pKa = 5.48DD38 pKa = 4.73GPFYY42 pKa = 10.93EE43 pKa = 6.02DD44 pKa = 3.44YY45 pKa = 11.38DD46 pKa = 4.03EE47 pKa = 4.64GTEE50 pKa = 4.16EE51 pKa = 4.33PACSGDD57 pKa = 3.24AA58 pKa = 3.71
Molecular weight: 6.51 kDa
Isoelectric point according different methods:
Protein with the highest isoelectric point:
>tr|A0A0H5BI79|A0A0H5BI79_BPK21 Uncharacterized protein OS=Pseudomonas phage KPP21 OX=1678082 PE=4 SV=1
MM1 pKa = 7.92LILQLVWLFLVFAAVTFWVSRR22 pKa = 11.84MEE24 pKa = 4.36PKK26 pKa = 10.57RR27 pKa = 11.84PWGWLWWVWLGVLAVSSHH45 pKa = 6.05LLAMVAVGIIVLFIVPP61 pKa = 4.41
MM1 pKa = 7.92LILQLVWLFLVFAAVTFWVSRR22 pKa = 11.84MEE24 pKa = 4.36PKK26 pKa = 10.57RR27 pKa = 11.84PWGWLWWVWLGVLAVSSHH45 pKa = 6.05LLAMVAVGIIVLFIVPP61 pKa = 4.41
Molecular weight: 7.11 kDa
Isoelectric point according different methods:
Peptides (in silico digests for buttom-up proteomics)
Below you can find in silico digests of the whole proteome with Trypsin, Chymotrypsin, Trypsin+LysC, LysN, ArgC proteases suitable for different mass spec machines.| Try ESI |
 |
|---|
| ChTry ESI |
|
|---|
| ArgC ESI |
|
|---|
| LysN ESI |
|
|---|
| TryLysC ESI |
|
|---|
| Try MALDI |
|
|---|
| ChTry MALDI |
|
|---|
| ArgC MALDI |
|
|---|
| LysN MALDI |
|
|---|
| TryLysC MALDI |
|
|---|
| Try LTQ |
|
|---|
| ChTry LTQ |
|
|---|
| ArgC LTQ |
|
|---|
| LysN LTQ |
|
|---|
| TryLysC LTQ |
|
|---|
| Try MSlow |
|
|---|
| ChTry MSlow |
|
|---|
| ArgC MSlow |
|
|---|
| LysN MSlow |
|
|---|
| TryLysC MSlow |
|
|---|
| Try MShigh |
|
|---|
| ChTry MShigh |
|
|---|
| ArgC MShigh |
|
|---|
| LysN MShigh |
|
|---|
| TryLysC MShigh |
|
|---|
General Statistics
Number of major isoforms |
Number of additional isoforms |
Number of all proteins |
Number of amino acids |
Min. Seq. Length |
Max. Seq. Length |
Avg. Seq. Length |
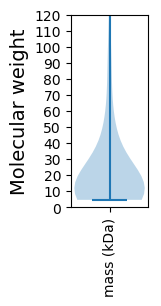
Avg. Mol. Weight |
|---|---|---|---|---|---|---|---|
0 |
23264 |
39 |
3403 |
205.9 |
23.03 |
Amino acid frequency
Ala |
Cys |
Asp |
Glu |
Phe |
Gly |
His |
Ile |
Lys |
Leu |
|---|---|---|---|---|---|---|---|---|---|
9.401 ± 0.531 | 0.993 ± 0.156 |
5.799 ± 0.129 | 7.058 ± 0.286 |
3.624 ± 0.133 | 6.676 ± 0.243 |
2.149 ± 0.207 | 4.862 ± 0.167 |
6.147 ± 0.287 | 9.237 ± 0.292 |
Met |
Asn |
Gln |
Pro |
Arg |
Ser |
Thr |
Val |
Trp |
Tyr |
|---|---|---|---|---|---|---|---|---|---|
3.146 ± 0.123 | 4.436 ± 0.169 |
3.783 ± 0.177 | 4.406 ± 0.26 |
5.266 ± 0.182 | 5.872 ± 0.199 |
5.536 ± 0.214 | 6.77 ± 0.162 |
1.367 ± 0.168 | 3.473 ± 0.25 |
Most of the basic statistics you can see at this page can be downloaded from this CSV file
See this proteome in:

Proteome-pI is available under Creative Commons Attribution-NoDerivs license, for more details see here
| Reference: Kozlowski LP. Proteome-pI 2.0: Proteome Isoelectric Point Database Update. Nucleic Acids Res. 2021, doi: 10.1093/nar/gkab944 | Contact: Lukasz P. Kozlowski |