Pseudomonas phage phi13
Taxonomy: Viruses; Riboviria; Orthornavirae; Duplornaviricota; Vidaverviricetes; Mindivirales; Cystoviridae; Cystovirus; Pseudomonas virus phi13
Average proteome isoelectric point is 6.3
Get precalculated fractions of proteins
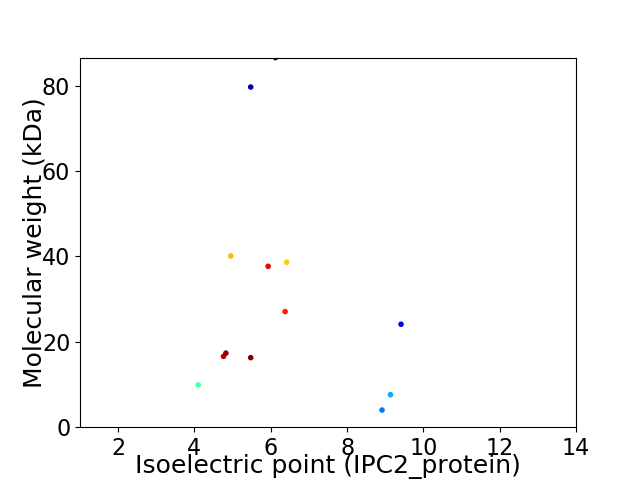
Virtual 2D-PAGE plot for 13 proteins (isoelectric point calculated using IPC2_protein)
Get csv file with sequences according to given criteria:
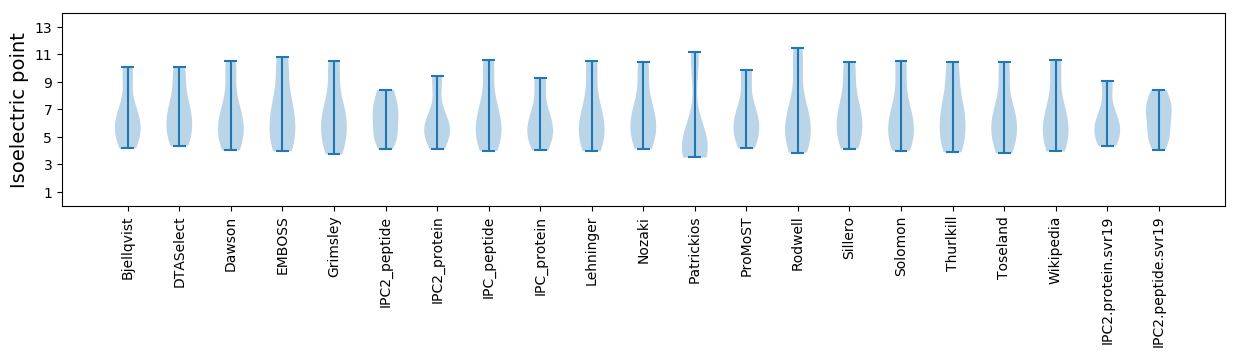
* You can choose from 21 different methods for calculating isoelectric point
Summary statistics related to proteome-wise predictions
Protein with the lowest isoelectric point:
>tr|Q9FZT6|Q9FZT6_9VIRU p3a OS=Pseudomonas phage phi13 OX=134554 GN=3a PE=4 SV=1
MM1 pKa = 8.35DD2 pKa = 6.43DD3 pKa = 4.87NNLLDD8 pKa = 3.77IPVDD12 pKa = 3.54HH13 pKa = 6.63VFTRR17 pKa = 11.84TEE19 pKa = 4.02VAEE22 pKa = 4.31GTAAGFAASGLLAVLPEE39 pKa = 4.18LKK41 pKa = 9.16KK42 pKa = 8.83TQLTEE47 pKa = 3.69ILSVSEE53 pKa = 4.37FDD55 pKa = 3.74GTSDD59 pKa = 3.79LMDD62 pKa = 3.33VVVSPNVVTRR72 pKa = 11.84VWLFQAISEE81 pKa = 4.44YY82 pKa = 10.13IARR85 pKa = 11.84GDD87 pKa = 3.57ADD89 pKa = 3.53GHH91 pKa = 4.74VV92 pKa = 3.59
MM1 pKa = 8.35DD2 pKa = 6.43DD3 pKa = 4.87NNLLDD8 pKa = 3.77IPVDD12 pKa = 3.54HH13 pKa = 6.63VFTRR17 pKa = 11.84TEE19 pKa = 4.02VAEE22 pKa = 4.31GTAAGFAASGLLAVLPEE39 pKa = 4.18LKK41 pKa = 9.16KK42 pKa = 8.83TQLTEE47 pKa = 3.69ILSVSEE53 pKa = 4.37FDD55 pKa = 3.74GTSDD59 pKa = 3.79LMDD62 pKa = 3.33VVVSPNVVTRR72 pKa = 11.84VWLFQAISEE81 pKa = 4.44YY82 pKa = 10.13IARR85 pKa = 11.84GDD87 pKa = 3.57ADD89 pKa = 3.53GHH91 pKa = 4.74VV92 pKa = 3.59
Molecular weight: 9.9 kDa
Isoelectric point according different methods:
Protein with the highest isoelectric point:
>tr|Q9FZU1|Q9FZU1_9VIRU p12 OS=Pseudomonas phage phi13 OX=134554 GN=12 PE=4 SV=1
MM1 pKa = 7.53GLYY4 pKa = 7.15TTYY7 pKa = 10.71KK8 pKa = 10.13KK9 pKa = 10.64SAEE12 pKa = 3.95QTVDD16 pKa = 3.58KK17 pKa = 10.94EE18 pKa = 3.93NDD20 pKa = 3.74SIGKK24 pKa = 9.44KK25 pKa = 9.64VVGFLTAPVSFKK37 pKa = 11.29DD38 pKa = 4.12DD39 pKa = 3.54VLSLRR44 pKa = 11.84NPSHH48 pKa = 5.17QRR50 pKa = 11.84SRR52 pKa = 11.84LGRR55 pKa = 11.84SDD57 pKa = 3.52LPGRR61 pKa = 11.84RR62 pKa = 11.84VAGSPPCGG70 pKa = 3.23
MM1 pKa = 7.53GLYY4 pKa = 7.15TTYY7 pKa = 10.71KK8 pKa = 10.13KK9 pKa = 10.64SAEE12 pKa = 3.95QTVDD16 pKa = 3.58KK17 pKa = 10.94EE18 pKa = 3.93NDD20 pKa = 3.74SIGKK24 pKa = 9.44KK25 pKa = 9.64VVGFLTAPVSFKK37 pKa = 11.29DD38 pKa = 4.12DD39 pKa = 3.54VLSLRR44 pKa = 11.84NPSHH48 pKa = 5.17QRR50 pKa = 11.84SRR52 pKa = 11.84LGRR55 pKa = 11.84SDD57 pKa = 3.52LPGRR61 pKa = 11.84RR62 pKa = 11.84VAGSPPCGG70 pKa = 3.23
Molecular weight: 7.62 kDa
Isoelectric point according different methods:
Peptides (in silico digests for buttom-up proteomics)
Below you can find in silico digests of the whole proteome with Trypsin, Chymotrypsin, Trypsin+LysC, LysN, ArgC proteases suitable for different mass spec machines.| Try ESI |
 |
|---|
| ChTry ESI |
|
|---|
| ArgC ESI |
|
|---|
| LysN ESI |
|
|---|
| TryLysC ESI |
|
|---|
| Try MALDI |
|
|---|
| ChTry MALDI |
|
|---|
| ArgC MALDI |
|
|---|
| LysN MALDI |
|
|---|
| TryLysC MALDI |
|
|---|
| Try LTQ |
|
|---|
| ChTry LTQ |
|
|---|
| ArgC LTQ |
|
|---|
| LysN LTQ |
|
|---|
| TryLysC LTQ |
|
|---|
| Try MSlow |
|
|---|
| ChTry MSlow |
|
|---|
| ArgC MSlow |
|
|---|
| LysN MSlow |
|
|---|
| TryLysC MSlow |
|
|---|
| Try MShigh |
|
|---|
| ChTry MShigh |
|
|---|
| ArgC MShigh |
|
|---|
| LysN MShigh |
|
|---|
| TryLysC MShigh |
|
|---|
General Statistics
Number of major isoforms |
Number of additional isoforms |
Number of all proteins |
Number of amino acids |
Min. Seq. Length |
Max. Seq. Length |
Avg. Seq. Length |
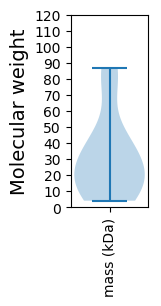
Avg. Mol. Weight |
|---|---|---|---|---|---|---|---|
0 |
3746 |
38 |
801 |
288.2 |
31.21 |
Amino acid frequency
Ala |
Cys |
Asp |
Glu |
Phe |
Gly |
His |
Ile |
Lys |
Leu |
|---|---|---|---|---|---|---|---|---|---|
11.559 ± 0.637 | 0.507 ± 0.151 |
5.713 ± 0.556 | 4.778 ± 0.412 |
3.764 ± 0.327 | 7.341 ± 0.38 |
1.789 ± 0.277 | 4.939 ± 0.397 |
3.951 ± 0.404 | 9.824 ± 0.491 |
Met |
Asn |
Gln |
Pro |
Arg |
Ser |
Thr |
Val |
Trp |
Tyr |
|---|---|---|---|---|---|---|---|---|---|
3.097 ± 0.315 | 3.284 ± 0.409 |
5.099 ± 0.442 | 2.776 ± 0.343 |
5.446 ± 0.55 | 8.089 ± 0.468 |
5.873 ± 0.312 | 8.142 ± 0.607 |
1.575 ± 0.324 | 2.456 ± 0.235 |
Most of the basic statistics you can see at this page can be downloaded from this CSV file
See this proteome in:

Proteome-pI is available under Creative Commons Attribution-NoDerivs license, for more details see here
| Reference: Kozlowski LP. Proteome-pI 2.0: Proteome Isoelectric Point Database Update. Nucleic Acids Res. 2021, doi: 10.1093/nar/gkab944 | Contact: Lukasz P. Kozlowski |