Aureimonas fodinaquatilis
Taxonomy: cellular organisms; Bacteria; Proteobacteria; Alphaproteobacteria; Hyphomicrobiales; Aurantimonadaceae; Aureimonas
Average proteome isoelectric point is 6.31
Get precalculated fractions of proteins
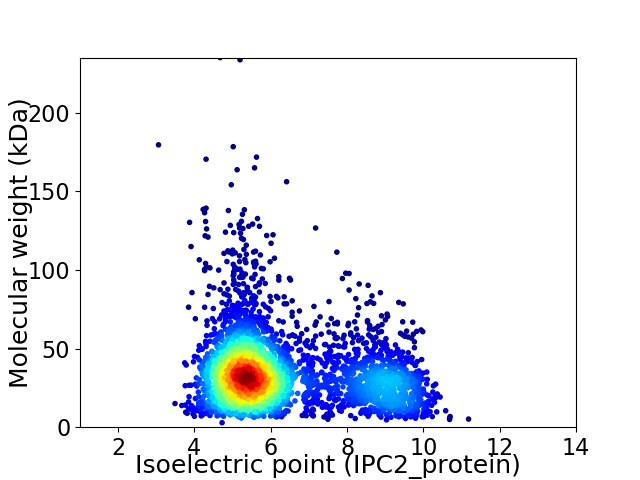
Virtual 2D-PAGE plot for 3594 proteins (isoelectric point calculated using IPC2_protein)
Get csv file with sequences according to given criteria:
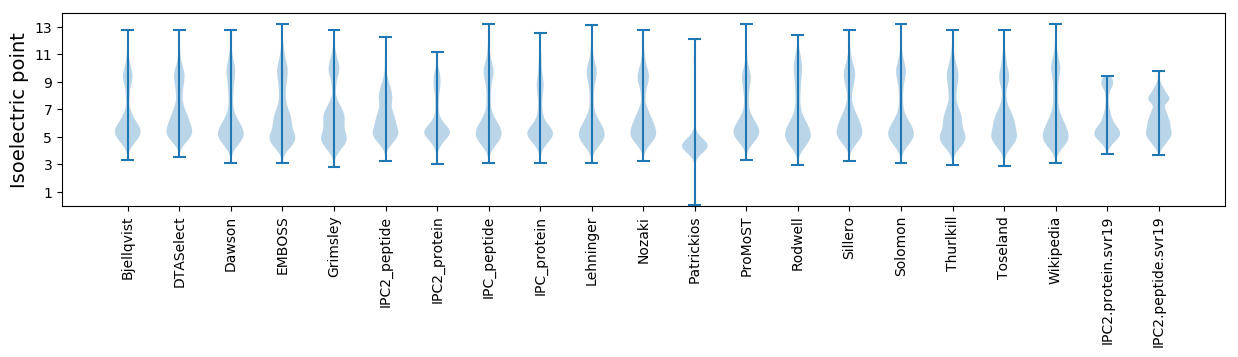
* You can choose from 21 different methods for calculating isoelectric point
Summary statistics related to proteome-wise predictions
Protein with the lowest isoelectric point:
>tr|A0A5B0DV82|A0A5B0DV82_9RHIZ Winged helix DNA-binding protein OS=Aureimonas fodinaquatilis OX=2565783 GN=FPY71_06875 PE=4 SV=1
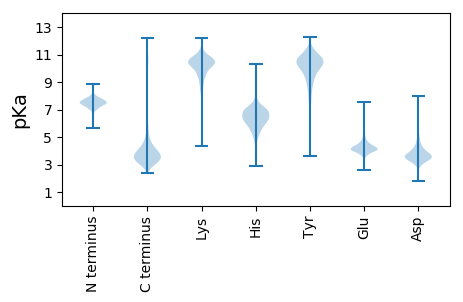
MM1 pKa = 7.57SNRR4 pKa = 11.84NTVLFGASLLAAIGAVAVDD23 pKa = 4.27YY24 pKa = 10.97SVSDD28 pKa = 3.58APRR31 pKa = 11.84AVAAQVEE38 pKa = 4.58DD39 pKa = 4.01AAPCAAATPSPASGARR55 pKa = 11.84NYY57 pKa = 11.43DD58 pKa = 4.39DD59 pKa = 3.94IANDD63 pKa = 3.74YY64 pKa = 11.15SSGSAPAPAPAPMPAEE80 pKa = 4.19NDD82 pKa = 3.67ANPCSAGVLL91 pKa = 3.81
MM1 pKa = 7.57SNRR4 pKa = 11.84NTVLFGASLLAAIGAVAVDD23 pKa = 4.27YY24 pKa = 10.97SVSDD28 pKa = 3.58APRR31 pKa = 11.84AVAAQVEE38 pKa = 4.58DD39 pKa = 4.01AAPCAAATPSPASGARR55 pKa = 11.84NYY57 pKa = 11.43DD58 pKa = 4.39DD59 pKa = 3.94IANDD63 pKa = 3.74YY64 pKa = 11.15SSGSAPAPAPAPMPAEE80 pKa = 4.19NDD82 pKa = 3.67ANPCSAGVLL91 pKa = 3.81
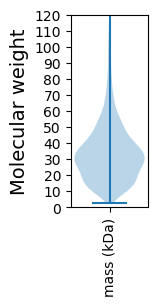
Molecular weight: 8.88 kDa
Isoelectric point according different methods:
Protein with the highest isoelectric point:
>tr|A0A5B0DRB3|A0A5B0DRB3_9RHIZ Sulfurtransferase OS=Aureimonas fodinaquatilis OX=2565783 GN=FPY71_12305 PE=4 SV=1
MM1 pKa = 7.35KK2 pKa = 9.43RR3 pKa = 11.84TYY5 pKa = 10.27QPSKK9 pKa = 9.73LVRR12 pKa = 11.84KK13 pKa = 9.15RR14 pKa = 11.84RR15 pKa = 11.84HH16 pKa = 4.42GFRR19 pKa = 11.84ARR21 pKa = 11.84MATTGGRR28 pKa = 11.84RR29 pKa = 11.84VIAARR34 pKa = 11.84RR35 pKa = 11.84ARR37 pKa = 11.84GRR39 pKa = 11.84KK40 pKa = 9.03RR41 pKa = 11.84LSAA44 pKa = 4.03
MM1 pKa = 7.35KK2 pKa = 9.43RR3 pKa = 11.84TYY5 pKa = 10.27QPSKK9 pKa = 9.73LVRR12 pKa = 11.84KK13 pKa = 9.15RR14 pKa = 11.84RR15 pKa = 11.84HH16 pKa = 4.42GFRR19 pKa = 11.84ARR21 pKa = 11.84MATTGGRR28 pKa = 11.84RR29 pKa = 11.84VIAARR34 pKa = 11.84RR35 pKa = 11.84ARR37 pKa = 11.84GRR39 pKa = 11.84KK40 pKa = 9.03RR41 pKa = 11.84LSAA44 pKa = 4.03
Molecular weight: 5.17 kDa
Isoelectric point according different methods:
Peptides (in silico digests for buttom-up proteomics)
Below you can find in silico digests of the whole proteome with Trypsin, Chymotrypsin, Trypsin+LysC, LysN, ArgC proteases suitable for different mass spec machines.| Try ESI |
 |
|---|
| ChTry ESI |
|
|---|
| ArgC ESI |
|
|---|
| LysN ESI |
|
|---|
| TryLysC ESI |
|
|---|
| Try MALDI |
|
|---|
| ChTry MALDI |
|
|---|
| ArgC MALDI |
|
|---|
| LysN MALDI |
|
|---|
| TryLysC MALDI |
|
|---|
| Try LTQ |
|
|---|
| ChTry LTQ |
|
|---|
| ArgC LTQ |
|
|---|
| LysN LTQ |
|
|---|
| TryLysC LTQ |
|
|---|
| Try MSlow |
|
|---|
| ChTry MSlow |
|
|---|
| ArgC MSlow |
|
|---|
| LysN MSlow |
|
|---|
| TryLysC MSlow |
|
|---|
| Try MShigh |
|
|---|
| ChTry MShigh |
|
|---|
| ArgC MShigh |
|
|---|
| LysN MShigh |
|
|---|
| TryLysC MShigh |
|
|---|
General Statistics
Number of major isoforms |
Number of additional isoforms |
Number of all proteins |
Number of amino acids |
Min. Seq. Length |
Max. Seq. Length |
Avg. Seq. Length |
Avg. Mol. Weight |
|---|---|---|---|---|---|---|---|
0 |
1177670 |
25 |
2166 |
327.7 |
35.58 |
Amino acid frequency
Ala |
Cys |
Asp |
Glu |
Phe |
Gly |
His |
Ile |
Lys |
Leu |
|---|---|---|---|---|---|---|---|---|---|
11.972 ± 0.05 | 0.785 ± 0.011 |
5.489 ± 0.033 | 5.729 ± 0.039 |
3.938 ± 0.025 | 8.436 ± 0.04 |
1.98 ± 0.021 | 5.545 ± 0.032 |
2.988 ± 0.027 | 10.277 ± 0.044 |
Met |
Asn |
Gln |
Pro |
Arg |
Ser |
Thr |
Val |
Trp |
Tyr |
|---|---|---|---|---|---|---|---|---|---|
2.582 ± 0.018 | 2.93 ± 0.022 |
4.947 ± 0.031 | 3.543 ± 0.025 |
6.687 ± 0.039 | 5.883 ± 0.025 |
5.286 ± 0.027 | 7.488 ± 0.035 |
1.221 ± 0.016 | 2.293 ± 0.022 |
Most of the basic statistics you can see at this page can be downloaded from this CSV file
See this proteome in:

Proteome-pI is available under Creative Commons Attribution-NoDerivs license, for more details see here
| Reference: Kozlowski LP. Proteome-pI 2.0: Proteome Isoelectric Point Database Update. Nucleic Acids Res. 2021, doi: 10.1093/nar/gkab944 | Contact: Lukasz P. Kozlowski |