Pectobacterium bacteriophage PM2
Taxonomy: Viruses; Duplodnaviria; Heunggongvirae; Uroviricota; Caudoviricetes; Caudovirales; Myoviridae; unclassified Myoviridae
Average proteome isoelectric point is 6.24
Get precalculated fractions of proteins
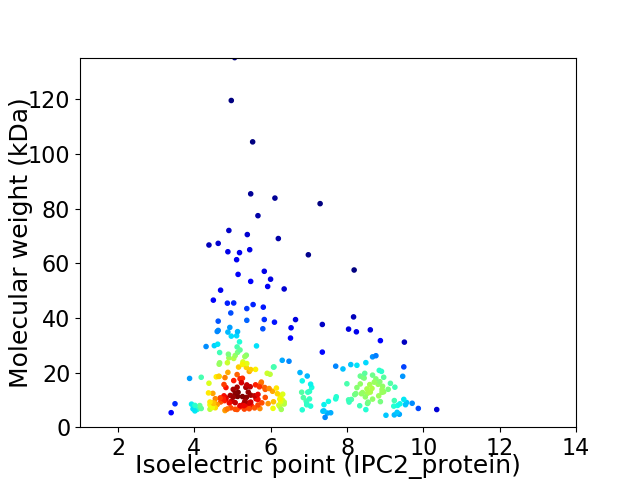
Virtual 2D-PAGE plot for 291 proteins (isoelectric point calculated using IPC2_protein)
Get csv file with sequences according to given criteria:
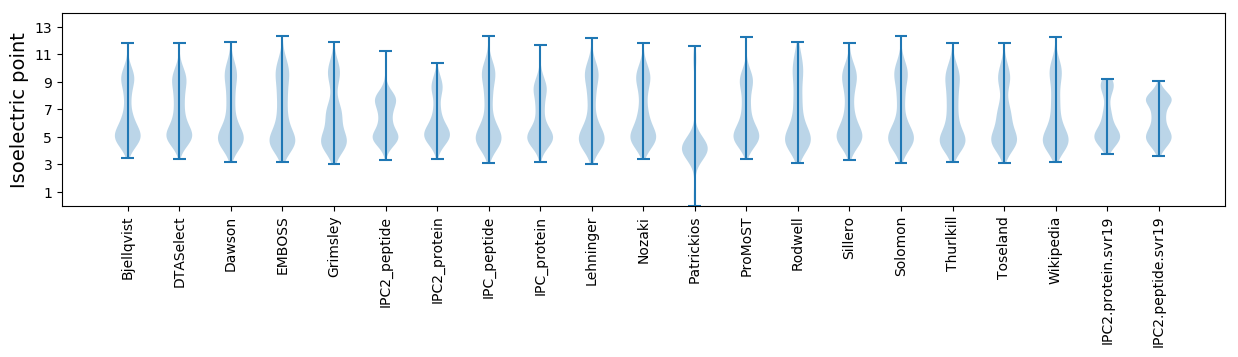
* You can choose from 21 different methods for calculating isoelectric point
Summary statistics related to proteome-wise predictions
Protein with the lowest isoelectric point:
>tr|A0A0A0Q0Q6|A0A0A0Q0Q6_9CAUD Uncharacterized protein OS=Pectobacterium bacteriophage PM2 OX=1429794 GN=PM2_156 PE=4 SV=1
MM1 pKa = 7.21SVNVEE6 pKa = 4.03CAIRR10 pKa = 11.84TATAALNNLIQIAKK24 pKa = 10.29DD25 pKa = 3.34EE26 pKa = 4.79GEE28 pKa = 4.39SEE30 pKa = 3.94VDD32 pKa = 2.48IWLDD36 pKa = 3.27FDD38 pKa = 4.65YY39 pKa = 11.2DD40 pKa = 4.26GEE42 pKa = 4.53GTKK45 pKa = 10.72CLTLKK50 pKa = 10.07TEE52 pKa = 4.4DD53 pKa = 3.71WASSSYY59 pKa = 11.34SCC61 pKa = 5.51
MM1 pKa = 7.21SVNVEE6 pKa = 4.03CAIRR10 pKa = 11.84TATAALNNLIQIAKK24 pKa = 10.29DD25 pKa = 3.34EE26 pKa = 4.79GEE28 pKa = 4.39SEE30 pKa = 3.94VDD32 pKa = 2.48IWLDD36 pKa = 3.27FDD38 pKa = 4.65YY39 pKa = 11.2DD40 pKa = 4.26GEE42 pKa = 4.53GTKK45 pKa = 10.72CLTLKK50 pKa = 10.07TEE52 pKa = 4.4DD53 pKa = 3.71WASSSYY59 pKa = 11.34SCC61 pKa = 5.51
Molecular weight: 6.72 kDa
Isoelectric point according different methods:
Protein with the highest isoelectric point:
>tr|A0A0A0Q0P2|A0A0A0Q0P2_9CAUD Endonuclease V OS=Pectobacterium bacteriophage PM2 OX=1429794 GN=PM2_131 PE=4 SV=1
MM1 pKa = 7.6LKK3 pKa = 10.44LIYY6 pKa = 9.91EE7 pKa = 4.56AGSKK11 pKa = 10.84GLMVNTRR18 pKa = 11.84DD19 pKa = 3.28SVQRR23 pKa = 11.84KK24 pKa = 7.73EE25 pKa = 4.03FSEE28 pKa = 4.22LKK30 pKa = 10.15QAGLVKK36 pKa = 10.65ASLGIGNSLRR46 pKa = 11.84VTLTSAGIAKK56 pKa = 8.18FAPKK60 pKa = 9.66RR61 pKa = 11.84RR62 pKa = 11.84KK63 pKa = 9.33
MM1 pKa = 7.6LKK3 pKa = 10.44LIYY6 pKa = 9.91EE7 pKa = 4.56AGSKK11 pKa = 10.84GLMVNTRR18 pKa = 11.84DD19 pKa = 3.28SVQRR23 pKa = 11.84KK24 pKa = 7.73EE25 pKa = 4.03FSEE28 pKa = 4.22LKK30 pKa = 10.15QAGLVKK36 pKa = 10.65ASLGIGNSLRR46 pKa = 11.84VTLTSAGIAKK56 pKa = 8.18FAPKK60 pKa = 9.66RR61 pKa = 11.84RR62 pKa = 11.84KK63 pKa = 9.33
Molecular weight: 6.86 kDa
Isoelectric point according different methods:
Peptides (in silico digests for buttom-up proteomics)
Below you can find in silico digests of the whole proteome with Trypsin, Chymotrypsin, Trypsin+LysC, LysN, ArgC proteases suitable for different mass spec machines.| Try ESI |
 |
|---|
| ChTry ESI |
|
|---|
| ArgC ESI |
|
|---|
| LysN ESI |
|
|---|
| TryLysC ESI |
|
|---|
| Try MALDI |
|
|---|
| ChTry MALDI |
|
|---|
| ArgC MALDI |
|
|---|
| LysN MALDI |
|
|---|
| TryLysC MALDI |
|
|---|
| Try LTQ |
|
|---|
| ChTry LTQ |
|
|---|
| ArgC LTQ |
|
|---|
| LysN LTQ |
|
|---|
| TryLysC LTQ |
|
|---|
| Try MSlow |
|
|---|
| ChTry MSlow |
|
|---|
| ArgC MSlow |
|
|---|
| LysN MSlow |
|
|---|
| TryLysC MSlow |
|
|---|
| Try MShigh |
|
|---|
| ChTry MShigh |
|
|---|
| ArgC MShigh |
|
|---|
| LysN MShigh |
|
|---|
| TryLysC MShigh |
|
|---|
General Statistics
Number of major isoforms |
Number of additional isoforms |
Number of all proteins |
Number of amino acids |
Min. Seq. Length |
Max. Seq. Length |
Avg. Seq. Length |
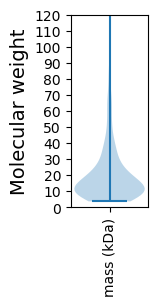
Avg. Mol. Weight |
|---|---|---|---|---|---|---|---|
0 |
53617 |
32 |
1242 |
184.3 |
20.96 |
Amino acid frequency
Ala |
Cys |
Asp |
Glu |
Phe |
Gly |
His |
Ile |
Lys |
Leu |
|---|---|---|---|---|---|---|---|---|---|
6.076 ± 0.18 | 1.123 ± 0.069 |
6.14 ± 0.098 | 7.074 ± 0.183 |
4.61 ± 0.115 | 5.791 ± 0.183 |
1.684 ± 0.066 | 7.766 ± 0.132 |
7.746 ± 0.192 | 7.74 ± 0.124 |
Met |
Asn |
Gln |
Pro |
Arg |
Ser |
Thr |
Val |
Trp |
Tyr |
|---|---|---|---|---|---|---|---|---|---|
2.663 ± 0.074 | 5.953 ± 0.123 |
3.426 ± 0.082 | 3.346 ± 0.088 |
4.135 ± 0.087 | 7.043 ± 0.15 |
5.735 ± 0.175 | 6.239 ± 0.13 |
1.399 ± 0.054 | 4.31 ± 0.127 |
Most of the basic statistics you can see at this page can be downloaded from this CSV file
See this proteome in:

Proteome-pI is available under Creative Commons Attribution-NoDerivs license, for more details see here
| Reference: Kozlowski LP. Proteome-pI 2.0: Proteome Isoelectric Point Database Update. Nucleic Acids Res. 2021, doi: 10.1093/nar/gkab944 | Contact: Lukasz P. Kozlowski |