Acetobacter oeni
Taxonomy: cellular organisms; Bacteria; Proteobacteria; Alphaproteobacteria; Rhodospirillales; Acetobacteraceae; Acetobacter
Average proteome isoelectric point is 6.66
Get precalculated fractions of proteins
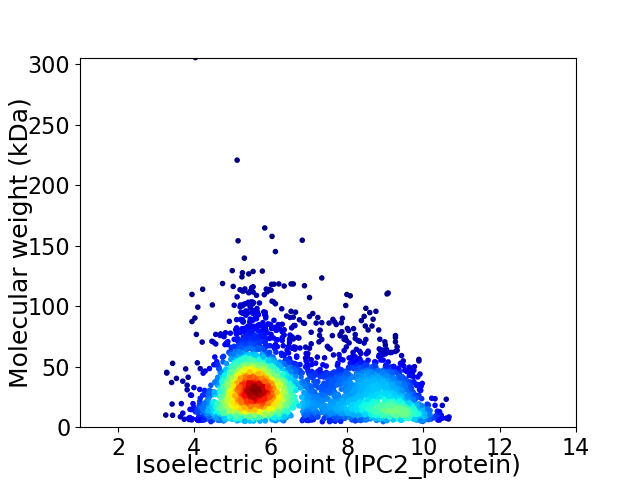
Virtual 2D-PAGE plot for 3655 proteins (isoelectric point calculated using IPC2_protein)
Get csv file with sequences according to given criteria:
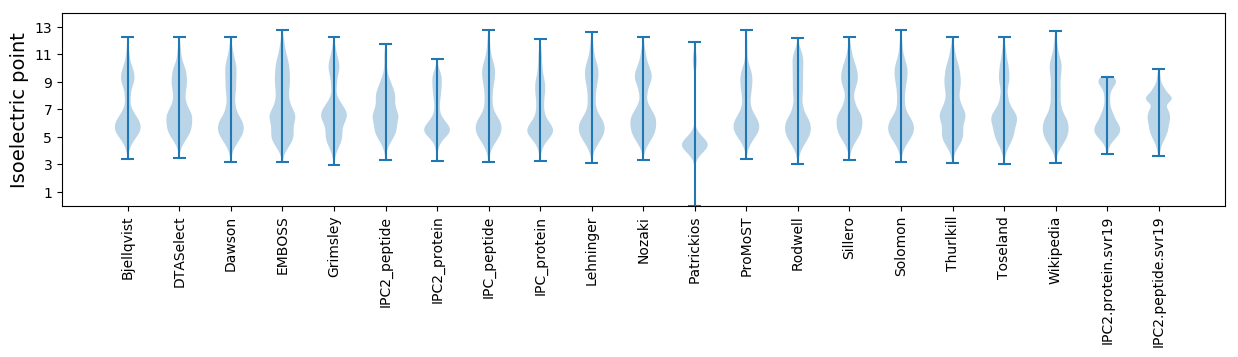
* You can choose from 21 different methods for calculating isoelectric point
Summary statistics related to proteome-wise predictions
Protein with the lowest isoelectric point:
>tr|A0A511XIX5|A0A511XIX5_9PROT Biotin--[acetyl-CoA-carboxylase] ligase OS=Acetobacter oeni OX=304077 GN=AOE01nite_10850 PE=4 SV=1
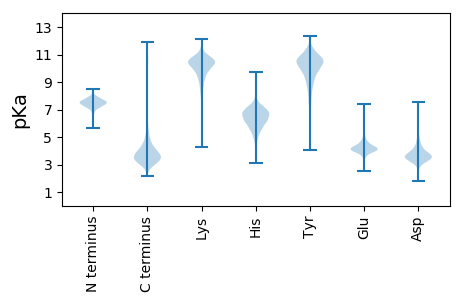
MM1 pKa = 7.6AFFTGYY7 pKa = 8.93MGLVAGGPASIANEE21 pKa = 4.06VSAGGYY27 pKa = 9.93ARR29 pKa = 11.84LPVSFSSPGDD39 pKa = 3.31GCLTVAASSSYY50 pKa = 10.39IYY52 pKa = 11.18GLATEE57 pKa = 4.54DD58 pKa = 2.98WGLITGIAIYY68 pKa = 10.62SGTTPDD74 pKa = 3.91EE75 pKa = 4.65SPVATWAVRR84 pKa = 11.84PRR86 pKa = 11.84SLSLGQTYY94 pKa = 7.47TVPLAALSLLIEE106 pKa = 4.18PRR108 pKa = 11.84AFFDD112 pKa = 4.44DD113 pKa = 4.38GDD115 pKa = 4.19VLGVTAGGADD125 pKa = 3.93IIAGQPLMFTDD136 pKa = 5.31GVLTPASDD144 pKa = 4.01GSSSSGSLTLAQLSTLVSEE163 pKa = 5.26LMQSLPEE170 pKa = 5.05DD171 pKa = 3.98DD172 pKa = 5.29PGDD175 pKa = 4.02GTSLWVNSGLLAISRR190 pKa = 11.84SSS192 pKa = 2.93
MM1 pKa = 7.6AFFTGYY7 pKa = 8.93MGLVAGGPASIANEE21 pKa = 4.06VSAGGYY27 pKa = 9.93ARR29 pKa = 11.84LPVSFSSPGDD39 pKa = 3.31GCLTVAASSSYY50 pKa = 10.39IYY52 pKa = 11.18GLATEE57 pKa = 4.54DD58 pKa = 2.98WGLITGIAIYY68 pKa = 10.62SGTTPDD74 pKa = 3.91EE75 pKa = 4.65SPVATWAVRR84 pKa = 11.84PRR86 pKa = 11.84SLSLGQTYY94 pKa = 7.47TVPLAALSLLIEE106 pKa = 4.18PRR108 pKa = 11.84AFFDD112 pKa = 4.44DD113 pKa = 4.38GDD115 pKa = 4.19VLGVTAGGADD125 pKa = 3.93IIAGQPLMFTDD136 pKa = 5.31GVLTPASDD144 pKa = 4.01GSSSSGSLTLAQLSTLVSEE163 pKa = 5.26LMQSLPEE170 pKa = 5.05DD171 pKa = 3.98DD172 pKa = 5.29PGDD175 pKa = 4.02GTSLWVNSGLLAISRR190 pKa = 11.84SSS192 pKa = 2.93
Molecular weight: 19.45 kDa
Isoelectric point according different methods:
Protein with the highest isoelectric point:
>tr|A0A511XQF3|A0A511XQF3_9PROT DNA-binding protein OS=Acetobacter oeni OX=304077 GN=AOE01nite_33890 PE=4 SV=1
MM1 pKa = 7.51IKK3 pKa = 10.48KK4 pKa = 10.19LDD6 pKa = 3.52ARR8 pKa = 11.84GDD10 pKa = 3.63RR11 pKa = 11.84EE12 pKa = 4.03IAPNEE17 pKa = 3.85ANVVRR22 pKa = 11.84RR23 pKa = 11.84IFRR26 pKa = 11.84DD27 pKa = 4.36FAAGIGPRR35 pKa = 11.84AIARR39 pKa = 11.84TLNDD43 pKa = 3.35EE44 pKa = 5.05SIPGPNGKK52 pKa = 9.12LWIDD56 pKa = 3.26TTIRR60 pKa = 11.84GHH62 pKa = 4.69VQRR65 pKa = 11.84GTGIINNEE73 pKa = 4.17LYY75 pKa = 10.7VGRR78 pKa = 11.84LVWNRR83 pKa = 11.84LRR85 pKa = 11.84YY86 pKa = 9.73IKK88 pKa = 10.62DD89 pKa = 3.08PSTGKK94 pKa = 10.14RR95 pKa = 11.84VSRR98 pKa = 11.84LNPEE102 pKa = 4.12SEE104 pKa = 4.23WIITEE109 pKa = 4.12VPEE112 pKa = 4.97LRR114 pKa = 11.84IVDD117 pKa = 3.8DD118 pKa = 4.87ALWQAVRR125 pKa = 11.84EE126 pKa = 4.16RR127 pKa = 11.84QAKK130 pKa = 9.52IAAQYY135 pKa = 10.51VNVISAVRR143 pKa = 11.84ASAANRR149 pKa = 11.84MNGMRR154 pKa = 11.84RR155 pKa = 11.84PKK157 pKa = 10.45SLFSGMVFCGVCGGTYY173 pKa = 9.16SLRR176 pKa = 11.84EE177 pKa = 3.97KK178 pKa = 10.89DD179 pKa = 5.21RR180 pKa = 11.84YY181 pKa = 10.11ACSNRR186 pKa = 11.84IANRR190 pKa = 11.84SCHH193 pKa = 5.57NKK195 pKa = 8.6ATILRR200 pKa = 11.84PPTLRR205 pKa = 11.84SACWPASSTSS215 pKa = 3.16
MM1 pKa = 7.51IKK3 pKa = 10.48KK4 pKa = 10.19LDD6 pKa = 3.52ARR8 pKa = 11.84GDD10 pKa = 3.63RR11 pKa = 11.84EE12 pKa = 4.03IAPNEE17 pKa = 3.85ANVVRR22 pKa = 11.84RR23 pKa = 11.84IFRR26 pKa = 11.84DD27 pKa = 4.36FAAGIGPRR35 pKa = 11.84AIARR39 pKa = 11.84TLNDD43 pKa = 3.35EE44 pKa = 5.05SIPGPNGKK52 pKa = 9.12LWIDD56 pKa = 3.26TTIRR60 pKa = 11.84GHH62 pKa = 4.69VQRR65 pKa = 11.84GTGIINNEE73 pKa = 4.17LYY75 pKa = 10.7VGRR78 pKa = 11.84LVWNRR83 pKa = 11.84LRR85 pKa = 11.84YY86 pKa = 9.73IKK88 pKa = 10.62DD89 pKa = 3.08PSTGKK94 pKa = 10.14RR95 pKa = 11.84VSRR98 pKa = 11.84LNPEE102 pKa = 4.12SEE104 pKa = 4.23WIITEE109 pKa = 4.12VPEE112 pKa = 4.97LRR114 pKa = 11.84IVDD117 pKa = 3.8DD118 pKa = 4.87ALWQAVRR125 pKa = 11.84EE126 pKa = 4.16RR127 pKa = 11.84QAKK130 pKa = 9.52IAAQYY135 pKa = 10.51VNVISAVRR143 pKa = 11.84ASAANRR149 pKa = 11.84MNGMRR154 pKa = 11.84RR155 pKa = 11.84PKK157 pKa = 10.45SLFSGMVFCGVCGGTYY173 pKa = 9.16SLRR176 pKa = 11.84EE177 pKa = 3.97KK178 pKa = 10.89DD179 pKa = 5.21RR180 pKa = 11.84YY181 pKa = 10.11ACSNRR186 pKa = 11.84IANRR190 pKa = 11.84SCHH193 pKa = 5.57NKK195 pKa = 8.6ATILRR200 pKa = 11.84PPTLRR205 pKa = 11.84SACWPASSTSS215 pKa = 3.16
Molecular weight: 24.11 kDa
Isoelectric point according different methods:
Peptides (in silico digests for buttom-up proteomics)
Below you can find in silico digests of the whole proteome with Trypsin, Chymotrypsin, Trypsin+LysC, LysN, ArgC proteases suitable for different mass spec machines.| Try ESI |
 |
|---|
| ChTry ESI |
|
|---|
| ArgC ESI |
|
|---|
| LysN ESI |
|
|---|
| TryLysC ESI |
|
|---|
| Try MALDI |
|
|---|
| ChTry MALDI |
|
|---|
| ArgC MALDI |
|
|---|
| LysN MALDI |
|
|---|
| TryLysC MALDI |
|
|---|
| Try LTQ |
|
|---|
| ChTry LTQ |
|
|---|
| ArgC LTQ |
|
|---|
| LysN LTQ |
|
|---|
| TryLysC LTQ |
|
|---|
| Try MSlow |
|
|---|
| ChTry MSlow |
|
|---|
| ArgC MSlow |
|
|---|
| LysN MSlow |
|
|---|
| TryLysC MSlow |
|
|---|
| Try MShigh |
|
|---|
| ChTry MShigh |
|
|---|
| ArgC MShigh |
|
|---|
| LysN MShigh |
|
|---|
| TryLysC MShigh |
|
|---|
General Statistics
Number of major isoforms |
Number of additional isoforms |
Number of all proteins |
Number of amino acids |
Min. Seq. Length |
Max. Seq. Length |
Avg. Seq. Length |
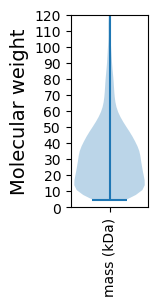
Avg. Mol. Weight |
|---|---|---|---|---|---|---|---|
0 |
1131415 |
40 |
3107 |
309.6 |
33.61 |
Amino acid frequency
Ala |
Cys |
Asp |
Glu |
Phe |
Gly |
His |
Ile |
Lys |
Leu |
|---|---|---|---|---|---|---|---|---|---|
11.593 ± 0.052 | 1.014 ± 0.013 |
5.606 ± 0.029 | 5.24 ± 0.038 |
3.621 ± 0.025 | 8.553 ± 0.048 |
2.289 ± 0.018 | 5.148 ± 0.028 |
2.876 ± 0.03 | 10.083 ± 0.045 |
Met |
Asn |
Gln |
Pro |
Arg |
Ser |
Thr |
Val |
Trp |
Tyr |
|---|---|---|---|---|---|---|---|---|---|
2.467 ± 0.016 | 2.672 ± 0.03 |
5.497 ± 0.034 | 3.133 ± 0.022 |
7.222 ± 0.047 | 6.13 ± 0.039 |
5.976 ± 0.041 | 7.237 ± 0.035 |
1.419 ± 0.016 | 2.225 ± 0.027 |
Most of the basic statistics you can see at this page can be downloaded from this CSV file
See this proteome in:

Proteome-pI is available under Creative Commons Attribution-NoDerivs license, for more details see here
| Reference: Kozlowski LP. Proteome-pI 2.0: Proteome Isoelectric Point Database Update. Nucleic Acids Res. 2021, doi: 10.1093/nar/gkab944 | Contact: Lukasz P. Kozlowski |