Methylobacterium gnaphalii
Taxonomy: cellular organisms; Bacteria; Proteobacteria; Alphaproteobacteria; Hyphomicrobiales; Methylobacteriaceae; Methylobacterium
Average proteome isoelectric point is 6.77
Get precalculated fractions of proteins
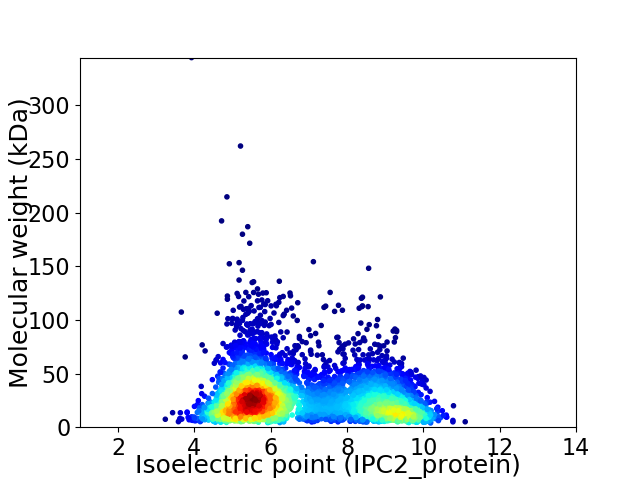
Virtual 2D-PAGE plot for 4699 proteins (isoelectric point calculated using IPC2_protein)
Get csv file with sequences according to given criteria:
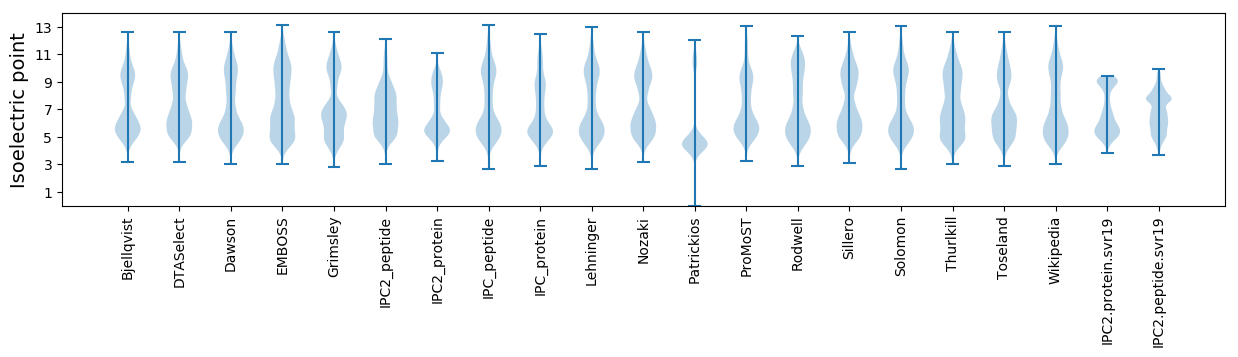
* You can choose from 21 different methods for calculating isoelectric point
Summary statistics related to proteome-wise predictions
Protein with the lowest isoelectric point:
>tr|A0A512JIV9|A0A512JIV9_9RHIZ Uncharacterized protein OS=Methylobacterium gnaphalii OX=1010610 GN=MGN01_17340 PE=4 SV=1
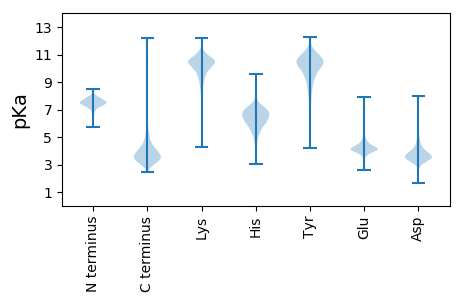
MM1 pKa = 7.76CCPCGFLCCGSDD13 pKa = 3.18EE14 pKa = 5.23FGGCGCDD21 pKa = 3.4DD22 pKa = 4.57CPDD25 pKa = 3.9PRR27 pKa = 11.84CQEE30 pKa = 4.08QAGEE34 pKa = 4.05AAPVGLPVNDD44 pKa = 4.79DD45 pKa = 4.53DD46 pKa = 5.71EE47 pKa = 5.7LADD50 pKa = 4.92DD51 pKa = 4.71MPLAALPRR59 pKa = 11.84AIRR62 pKa = 11.84RR63 pKa = 11.84FRR65 pKa = 11.84CEE67 pKa = 3.38EE68 pKa = 3.61VRR70 pKa = 11.84PP71 pKa = 3.89
MM1 pKa = 7.76CCPCGFLCCGSDD13 pKa = 3.18EE14 pKa = 5.23FGGCGCDD21 pKa = 3.4DD22 pKa = 4.57CPDD25 pKa = 3.9PRR27 pKa = 11.84CQEE30 pKa = 4.08QAGEE34 pKa = 4.05AAPVGLPVNDD44 pKa = 4.79DD45 pKa = 4.53DD46 pKa = 5.71EE47 pKa = 5.7LADD50 pKa = 4.92DD51 pKa = 4.71MPLAALPRR59 pKa = 11.84AIRR62 pKa = 11.84RR63 pKa = 11.84FRR65 pKa = 11.84CEE67 pKa = 3.38EE68 pKa = 3.61VRR70 pKa = 11.84PP71 pKa = 3.89
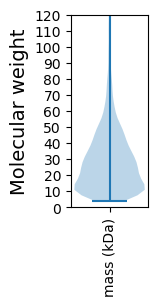
Molecular weight: 7.61 kDa
Isoelectric point according different methods:
Protein with the highest isoelectric point:
>tr|A0A512JQF4|A0A512JQF4_9RHIZ ModE family transcriptional regulator OS=Methylobacterium gnaphalii OX=1010610 GN=MGN01_40400 PE=4 SV=1
MM1 pKa = 7.35KK2 pKa = 9.43RR3 pKa = 11.84TYY5 pKa = 10.27QPSKK9 pKa = 9.73LVRR12 pKa = 11.84KK13 pKa = 9.15RR14 pKa = 11.84RR15 pKa = 11.84HH16 pKa = 4.42GFRR19 pKa = 11.84ARR21 pKa = 11.84MATAGGRR28 pKa = 11.84KK29 pKa = 9.15VIAARR34 pKa = 11.84RR35 pKa = 11.84AHH37 pKa = 5.62GRR39 pKa = 11.84KK40 pKa = 9.35KK41 pKa = 10.66LSAA44 pKa = 3.99
MM1 pKa = 7.35KK2 pKa = 9.43RR3 pKa = 11.84TYY5 pKa = 10.27QPSKK9 pKa = 9.73LVRR12 pKa = 11.84KK13 pKa = 9.15RR14 pKa = 11.84RR15 pKa = 11.84HH16 pKa = 4.42GFRR19 pKa = 11.84ARR21 pKa = 11.84MATAGGRR28 pKa = 11.84KK29 pKa = 9.15VIAARR34 pKa = 11.84RR35 pKa = 11.84AHH37 pKa = 5.62GRR39 pKa = 11.84KK40 pKa = 9.35KK41 pKa = 10.66LSAA44 pKa = 3.99
Molecular weight: 5.06 kDa
Isoelectric point according different methods:
Peptides (in silico digests for buttom-up proteomics)
Below you can find in silico digests of the whole proteome with Trypsin, Chymotrypsin, Trypsin+LysC, LysN, ArgC proteases suitable for different mass spec machines.| Try ESI |
 |
|---|
| ChTry ESI |
|
|---|
| ArgC ESI |
|
|---|
| LysN ESI |
|
|---|
| TryLysC ESI |
|
|---|
| Try MALDI |
|
|---|
| ChTry MALDI |
|
|---|
| ArgC MALDI |
|
|---|
| LysN MALDI |
|
|---|
| TryLysC MALDI |
|
|---|
| Try LTQ |
|
|---|
| ChTry LTQ |
|
|---|
| ArgC LTQ |
|
|---|
| LysN LTQ |
|
|---|
| TryLysC LTQ |
|
|---|
| Try MSlow |
|
|---|
| ChTry MSlow |
|
|---|
| ArgC MSlow |
|
|---|
| LysN MSlow |
|
|---|
| TryLysC MSlow |
|
|---|
| Try MShigh |
|
|---|
| ChTry MShigh |
|
|---|
| ArgC MShigh |
|
|---|
| LysN MShigh |
|
|---|
| TryLysC MShigh |
|
|---|
General Statistics
Number of major isoforms |
Number of additional isoforms |
Number of all proteins |
Number of amino acids |
Min. Seq. Length |
Max. Seq. Length |
Avg. Seq. Length |
Avg. Mol. Weight |
|---|---|---|---|---|---|---|---|
0 |
1334609 |
40 |
3311 |
284.0 |
30.6 |
Amino acid frequency
Ala |
Cys |
Asp |
Glu |
Phe |
Gly |
His |
Ile |
Lys |
Leu |
|---|---|---|---|---|---|---|---|---|---|
13.377 ± 0.059 | 0.838 ± 0.011 |
5.589 ± 0.028 | 5.722 ± 0.032 |
3.428 ± 0.026 | 8.895 ± 0.037 |
1.961 ± 0.016 | 4.772 ± 0.025 |
3.005 ± 0.035 | 10.073 ± 0.041 |
Met |
Asn |
Gln |
Pro |
Arg |
Ser |
Thr |
Val |
Trp |
Tyr |
|---|---|---|---|---|---|---|---|---|---|
2.171 ± 0.017 | 2.293 ± 0.027 |
5.574 ± 0.033 | 2.937 ± 0.022 |
7.773 ± 0.039 | 5.464 ± 0.024 |
5.39 ± 0.021 | 7.448 ± 0.031 |
1.229 ± 0.016 | 2.061 ± 0.019 |
Most of the basic statistics you can see at this page can be downloaded from this CSV file
See this proteome in:

Proteome-pI is available under Creative Commons Attribution-NoDerivs license, for more details see here
| Reference: Kozlowski LP. Proteome-pI 2.0: Proteome Isoelectric Point Database Update. Nucleic Acids Res. 2021, doi: 10.1093/nar/gkab944 | Contact: Lukasz P. Kozlowski |