Leptospirillum sp. Group IV UBA BS
Taxonomy: cellular organisms; Bacteria; Nitrospirae; Nitrospira; Nitrospirales; Nitrospiraceae; Leptospirillum; Leptospirillum sp. Group IV
Average proteome isoelectric point is 7.1
Get precalculated fractions of proteins
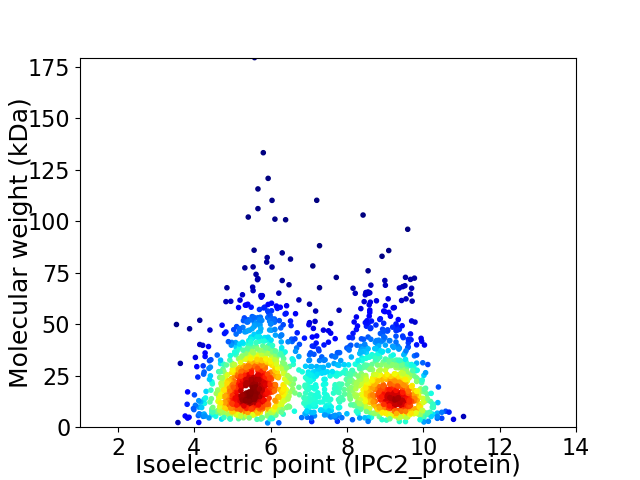
Virtual 2D-PAGE plot for 1878 proteins (isoelectric point calculated using IPC2_protein)
Get csv file with sequences according to given criteria:
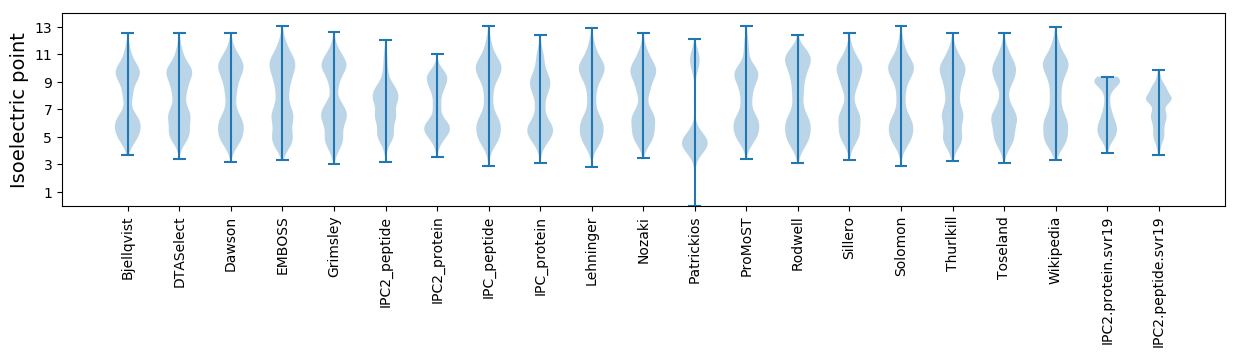
* You can choose from 21 different methods for calculating isoelectric point
Summary statistics related to proteome-wise predictions
Protein with the lowest isoelectric point:
>tr|T0Z678|T0Z678_9BACT Uncharacterized protein OS=Leptospirillum sp. Group IV 'UBA BS' OX=1260983 GN=D084_Lepto4C00422G0005 PE=4 SV=1
MM1 pKa = 7.89PSLLSWFLWRR11 pKa = 11.84NILDD15 pKa = 3.55ILAVWFIFYY24 pKa = 9.17QIPSPHH30 pKa = 6.47PTDD33 pKa = 4.88PGLPDD38 pKa = 4.35CLWVPVSFSSLLSDD52 pKa = 4.12GG53 pKa = 4.06
MM1 pKa = 7.89PSLLSWFLWRR11 pKa = 11.84NILDD15 pKa = 3.55ILAVWFIFYY24 pKa = 9.17QIPSPHH30 pKa = 6.47PTDD33 pKa = 4.88PGLPDD38 pKa = 4.35CLWVPVSFSSLLSDD52 pKa = 4.12GG53 pKa = 4.06
Molecular weight: 6.09 kDa
Isoelectric point according different methods:
Protein with the highest isoelectric point:
>tr|T0XND4|T0XND4_9BACT Hcy-binding domain-containing protein (Fragment) OS=Leptospirillum sp. Group IV 'UBA BS' OX=1260983 GN=D084_Lepto4C00467G0001 PE=4 SV=1
MM1 pKa = 7.6SLTFNPSNLRR11 pKa = 11.84RR12 pKa = 11.84TRR14 pKa = 11.84THH16 pKa = 6.36GFRR19 pKa = 11.84KK20 pKa = 10.05RR21 pKa = 11.84MATTAGKK28 pKa = 10.14KK29 pKa = 8.16VLKK32 pKa = 10.07KK33 pKa = 10.03RR34 pKa = 11.84RR35 pKa = 11.84AKK37 pKa = 10.05GRR39 pKa = 11.84YY40 pKa = 8.53RR41 pKa = 11.84LTVV44 pKa = 2.95
MM1 pKa = 7.6SLTFNPSNLRR11 pKa = 11.84RR12 pKa = 11.84TRR14 pKa = 11.84THH16 pKa = 6.36GFRR19 pKa = 11.84KK20 pKa = 10.05RR21 pKa = 11.84MATTAGKK28 pKa = 10.14KK29 pKa = 8.16VLKK32 pKa = 10.07KK33 pKa = 10.03RR34 pKa = 11.84RR35 pKa = 11.84AKK37 pKa = 10.05GRR39 pKa = 11.84YY40 pKa = 8.53RR41 pKa = 11.84LTVV44 pKa = 2.95
Molecular weight: 5.19 kDa
Isoelectric point according different methods:
Peptides (in silico digests for buttom-up proteomics)
Below you can find in silico digests of the whole proteome with Trypsin, Chymotrypsin, Trypsin+LysC, LysN, ArgC proteases suitable for different mass spec machines.| Try ESI |
 |
|---|
| ChTry ESI |
|
|---|
| ArgC ESI |
|
|---|
| LysN ESI |
|
|---|
| TryLysC ESI |
|
|---|
| Try MALDI |
|
|---|
| ChTry MALDI |
|
|---|
| ArgC MALDI |
|
|---|
| LysN MALDI |
|
|---|
| TryLysC MALDI |
|
|---|
| Try LTQ |
|
|---|
| ChTry LTQ |
|
|---|
| ArgC LTQ |
|
|---|
| LysN LTQ |
|
|---|
| TryLysC LTQ |
|
|---|
| Try MSlow |
|
|---|
| ChTry MSlow |
|
|---|
| ArgC MSlow |
|
|---|
| LysN MSlow |
|
|---|
| TryLysC MSlow |
|
|---|
| Try MShigh |
|
|---|
| ChTry MShigh |
|
|---|
| ArgC MShigh |
|
|---|
| LysN MShigh |
|
|---|
| TryLysC MShigh |
|
|---|
General Statistics
Number of major isoforms |
Number of additional isoforms |
Number of all proteins |
Number of amino acids |
Min. Seq. Length |
Max. Seq. Length |
Avg. Seq. Length |
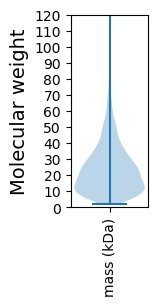
Avg. Mol. Weight |
|---|---|---|---|---|---|---|---|
0 |
417274 |
21 |
1614 |
222.2 |
24.53 |
Amino acid frequency
Ala |
Cys |
Asp |
Glu |
Phe |
Gly |
His |
Ile |
Lys |
Leu |
|---|---|---|---|---|---|---|---|---|---|
8.093 ± 0.061 | 0.846 ± 0.021 |
4.906 ± 0.04 | 6.584 ± 0.063 |
4.228 ± 0.039 | 8.759 ± 0.071 |
2.13 ± 0.026 | 5.247 ± 0.05 |
4.074 ± 0.059 | 11.081 ± 0.074 |
Met |
Asn |
Gln |
Pro |
Arg |
Ser |
Thr |
Val |
Trp |
Tyr |
|---|---|---|---|---|---|---|---|---|---|
2.261 ± 0.026 | 2.645 ± 0.04 |
6.072 ± 0.057 | 2.65 ± 0.03 |
7.887 ± 0.082 | 7.061 ± 0.056 |
5.057 ± 0.047 | 6.909 ± 0.052 |
1.225 ± 0.024 | 2.276 ± 0.032 |
Most of the basic statistics you can see at this page can be downloaded from this CSV file
See this proteome in:

Proteome-pI is available under Creative Commons Attribution-NoDerivs license, for more details see here
| Reference: Kozlowski LP. Proteome-pI 2.0: Proteome Isoelectric Point Database Update. Nucleic Acids Res. 2021, doi: 10.1093/nar/gkab944 | Contact: Lukasz P. Kozlowski |