Escherichia phage P2
Taxonomy: Viruses; Duplodnaviria; Heunggongvirae; Uroviricota; Caudoviricetes; Caudovirales; Myoviridae; Peduovirinae; Peduovirus; Escherichia virus magyaro
Average proteome isoelectric point is 6.82
Get precalculated fractions of proteins
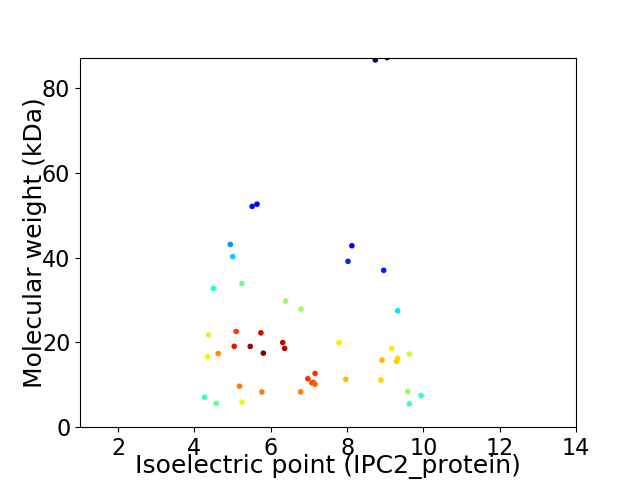
Virtual 2D-PAGE plot for 46 proteins (isoelectric point calculated using IPC2_protein)
Get csv file with sequences according to given criteria:
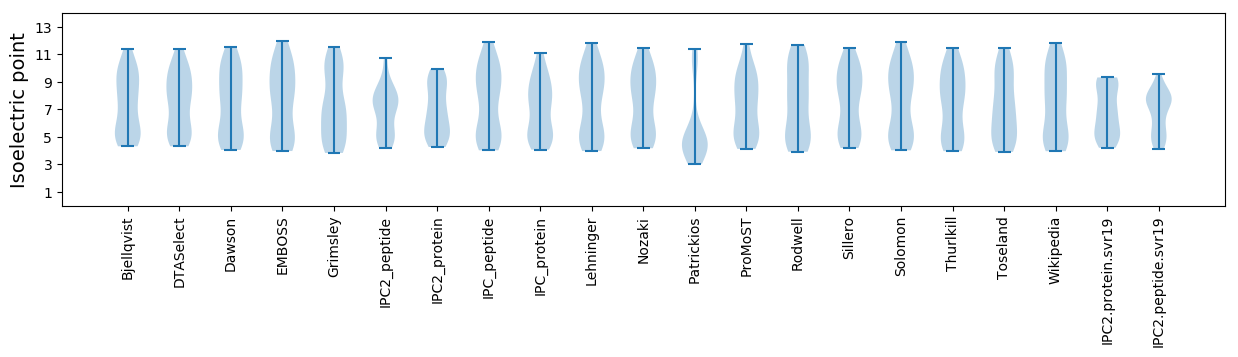
* You can choose from 21 different methods for calculating isoelectric point
Summary statistics related to proteome-wise predictions
Protein with the lowest isoelectric point:
>tr|M1RZ27|M1RZ27_BPP2 Phage outer membrane lipoprotein Rz1 OS=Escherichia phage P2 OX=2681594 PE=4 SV=1
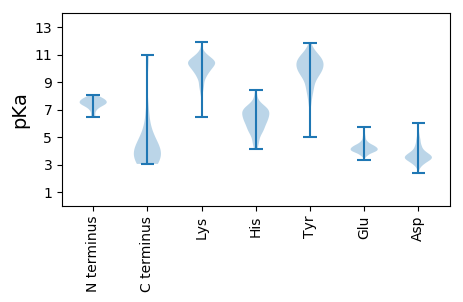
MM1 pKa = 7.21KK2 pKa = 9.98TFALQGDD9 pKa = 4.3TLDD12 pKa = 4.87AICVRR17 pKa = 11.84YY18 pKa = 9.91YY19 pKa = 11.07GRR21 pKa = 11.84TDD23 pKa = 3.38GVVEE27 pKa = 4.28TVLAANPGLAEE38 pKa = 4.58LGAVLPHH45 pKa = 5.85GTAVEE50 pKa = 4.18LPDD53 pKa = 3.66VQTAPVAEE61 pKa = 4.29TVNLWEE67 pKa = 4.2
MM1 pKa = 7.21KK2 pKa = 9.98TFALQGDD9 pKa = 4.3TLDD12 pKa = 4.87AICVRR17 pKa = 11.84YY18 pKa = 9.91YY19 pKa = 11.07GRR21 pKa = 11.84TDD23 pKa = 3.38GVVEE27 pKa = 4.28TVLAANPGLAEE38 pKa = 4.58LGAVLPHH45 pKa = 5.85GTAVEE50 pKa = 4.18LPDD53 pKa = 3.66VQTAPVAEE61 pKa = 4.29TVNLWEE67 pKa = 4.2
Molecular weight: 7.07 kDa
Isoelectric point according different methods:
Protein with the highest isoelectric point:
>tr|M1T2Q6|M1T2Q6_BPP2 Phage tail protein OS=Escherichia phage P2 OX=2681594 PE=4 SV=1
MM1 pKa = 7.6IGVLIVVGKK10 pKa = 9.79VLAGGEE16 pKa = 4.47PITPRR21 pKa = 11.84LFIGRR26 pKa = 11.84MLLGGFVSMVAGVVLVQFPDD46 pKa = 3.41LSLPAVCGIGSMLGIAGYY64 pKa = 8.18QVIEE68 pKa = 3.82IAIQRR73 pKa = 11.84RR74 pKa = 11.84FKK76 pKa = 11.29GRR78 pKa = 11.84GKK80 pKa = 9.83PP81 pKa = 3.39
MM1 pKa = 7.6IGVLIVVGKK10 pKa = 9.79VLAGGEE16 pKa = 4.47PITPRR21 pKa = 11.84LFIGRR26 pKa = 11.84MLLGGFVSMVAGVVLVQFPDD46 pKa = 3.41LSLPAVCGIGSMLGIAGYY64 pKa = 8.18QVIEE68 pKa = 3.82IAIQRR73 pKa = 11.84RR74 pKa = 11.84FKK76 pKa = 11.29GRR78 pKa = 11.84GKK80 pKa = 9.83PP81 pKa = 3.39
Molecular weight: 8.45 kDa
Isoelectric point according different methods:
Peptides (in silico digests for buttom-up proteomics)
Below you can find in silico digests of the whole proteome with Trypsin, Chymotrypsin, Trypsin+LysC, LysN, ArgC proteases suitable for different mass spec machines.| Try ESI |
 |
|---|
| ChTry ESI |
|
|---|
| ArgC ESI |
|
|---|
| LysN ESI |
|
|---|
| TryLysC ESI |
|
|---|
| Try MALDI |
|
|---|
| ChTry MALDI |
|
|---|
| ArgC MALDI |
|
|---|
| LysN MALDI |
|
|---|
| TryLysC MALDI |
|
|---|
| Try LTQ |
|
|---|
| ChTry LTQ |
|
|---|
| ArgC LTQ |
|
|---|
| LysN LTQ |
|
|---|
| TryLysC LTQ |
|
|---|
| Try MSlow |
|
|---|
| ChTry MSlow |
|
|---|
| ArgC MSlow |
|
|---|
| LysN MSlow |
|
|---|
| TryLysC MSlow |
|
|---|
| Try MShigh |
|
|---|
| ChTry MShigh |
|
|---|
| ArgC MShigh |
|
|---|
| LysN MShigh |
|
|---|
| TryLysC MShigh |
|
|---|
General Statistics
Number of major isoforms |
Number of additional isoforms |
Number of all proteins |
Number of amino acids |
Min. Seq. Length |
Max. Seq. Length |
Avg. Seq. Length |
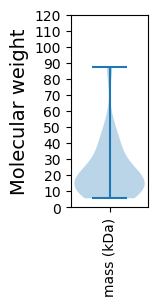
Avg. Mol. Weight |
|---|---|---|---|---|---|---|---|
0 |
9700 |
51 |
815 |
210.9 |
23.35 |
Amino acid frequency
Ala |
Cys |
Asp |
Glu |
Phe |
Gly |
His |
Ile |
Lys |
Leu |
|---|---|---|---|---|---|---|---|---|---|
10.258 ± 0.62 | 1.01 ± 0.132 |
5.423 ± 0.245 | 6.175 ± 0.311 |
3.33 ± 0.222 | 6.804 ± 0.31 |
1.732 ± 0.174 | 5.464 ± 0.211 |
5.32 ± 0.302 | 9.258 ± 0.305 |
Met |
Asn |
Gln |
Pro |
Arg |
Ser |
Thr |
Val |
Trp |
Tyr |
|---|---|---|---|---|---|---|---|---|---|
2.753 ± 0.195 | 3.928 ± 0.268 |
4.825 ± 0.386 | 3.856 ± 0.199 |
6.557 ± 0.464 | 5.99 ± 0.253 |
6.577 ± 0.376 | 6.577 ± 0.327 |
1.433 ± 0.109 | 2.732 ± 0.182 |
Most of the basic statistics you can see at this page can be downloaded from this CSV file
See this proteome in:

Proteome-pI is available under Creative Commons Attribution-NoDerivs license, for more details see here
| Reference: Kozlowski LP. Proteome-pI 2.0: Proteome Isoelectric Point Database Update. Nucleic Acids Res. 2021, doi: 10.1093/nar/gkab944 | Contact: Lukasz P. Kozlowski |