Lichenibacterium minor
Taxonomy: cellular organisms; Bacteria; Proteobacteria; Alphaproteobacteria; Hyphomicrobiales; Lichenibacteriaceae; Lichenibacterium
Average proteome isoelectric point is 6.81
Get precalculated fractions of proteins
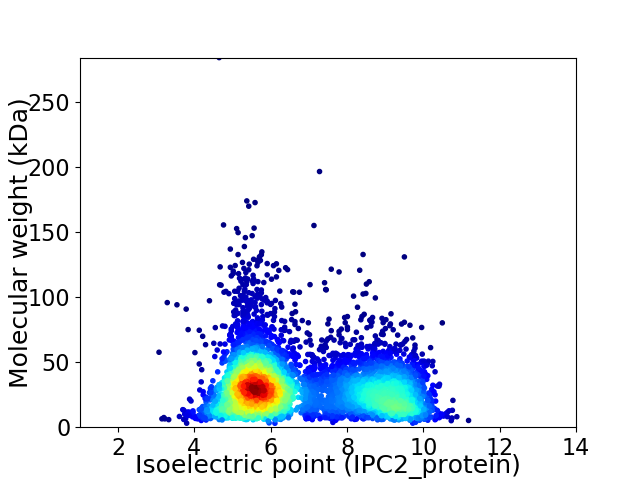
Virtual 2D-PAGE plot for 5408 proteins (isoelectric point calculated using IPC2_protein)
Get csv file with sequences according to given criteria:
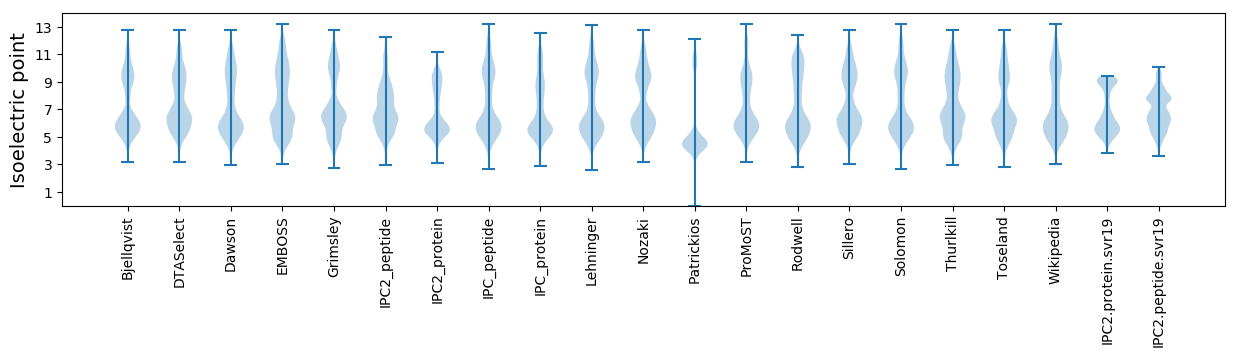
* You can choose from 21 different methods for calculating isoelectric point
Summary statistics related to proteome-wise predictions
Protein with the lowest isoelectric point:
>tr|A0A4Q2U9L3|A0A4Q2U9L3_9RHIZ Porphobilinogen deaminase OS=Lichenibacterium minor OX=2316528 GN=hemC PE=3 SV=1
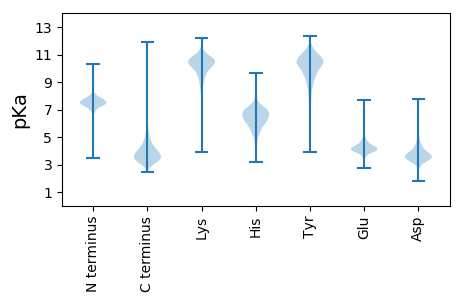
MM1 pKa = 7.32GCAGPCALDD10 pKa = 3.31TSPPFDD16 pKa = 3.35RR17 pKa = 11.84AAPAFCGDD25 pKa = 3.89AGVALPLEE33 pKa = 4.77DD34 pKa = 4.43ALADD38 pKa = 3.71AFRR41 pKa = 11.84CGAAVACVGVAAPPPDD57 pKa = 3.77AVPAFF62 pKa = 3.93
MM1 pKa = 7.32GCAGPCALDD10 pKa = 3.31TSPPFDD16 pKa = 3.35RR17 pKa = 11.84AAPAFCGDD25 pKa = 3.89AGVALPLEE33 pKa = 4.77DD34 pKa = 4.43ALADD38 pKa = 3.71AFRR41 pKa = 11.84CGAAVACVGVAAPPPDD57 pKa = 3.77AVPAFF62 pKa = 3.93
Molecular weight: 5.95 kDa
Isoelectric point according different methods:
Protein with the highest isoelectric point:
>tr|A0A4V1RUI9|A0A4V1RUI9_9RHIZ Oxidase OS=Lichenibacterium minor OX=2316528 GN=D3273_14450 PE=4 SV=1
MM1 pKa = 7.35KK2 pKa = 9.43RR3 pKa = 11.84TYY5 pKa = 10.09QPSKK9 pKa = 8.8IVRR12 pKa = 11.84KK13 pKa = 9.24RR14 pKa = 11.84RR15 pKa = 11.84HH16 pKa = 4.55GFRR19 pKa = 11.84ARR21 pKa = 11.84MATVGGRR28 pKa = 11.84RR29 pKa = 11.84IIAARR34 pKa = 11.84RR35 pKa = 11.84ARR37 pKa = 11.84GRR39 pKa = 11.84KK40 pKa = 9.03RR41 pKa = 11.84LSAA44 pKa = 4.03
MM1 pKa = 7.35KK2 pKa = 9.43RR3 pKa = 11.84TYY5 pKa = 10.09QPSKK9 pKa = 8.8IVRR12 pKa = 11.84KK13 pKa = 9.24RR14 pKa = 11.84RR15 pKa = 11.84HH16 pKa = 4.55GFRR19 pKa = 11.84ARR21 pKa = 11.84MATVGGRR28 pKa = 11.84RR29 pKa = 11.84IIAARR34 pKa = 11.84RR35 pKa = 11.84ARR37 pKa = 11.84GRR39 pKa = 11.84KK40 pKa = 9.03RR41 pKa = 11.84LSAA44 pKa = 4.03
Molecular weight: 5.18 kDa
Isoelectric point according different methods:
Peptides (in silico digests for buttom-up proteomics)
Below you can find in silico digests of the whole proteome with Trypsin, Chymotrypsin, Trypsin+LysC, LysN, ArgC proteases suitable for different mass spec machines.| Try ESI |
 |
|---|
| ChTry ESI |
|
|---|
| ArgC ESI |
|
|---|
| LysN ESI |
|
|---|
| TryLysC ESI |
|
|---|
| Try MALDI |
|
|---|
| ChTry MALDI |
|
|---|
| ArgC MALDI |
|
|---|
| LysN MALDI |
|
|---|
| TryLysC MALDI |
|
|---|
| Try LTQ |
|
|---|
| ChTry LTQ |
|
|---|
| ArgC LTQ |
|
|---|
| LysN LTQ |
|
|---|
| TryLysC LTQ |
|
|---|
| Try MSlow |
|
|---|
| ChTry MSlow |
|
|---|
| ArgC MSlow |
|
|---|
| LysN MSlow |
|
|---|
| TryLysC MSlow |
|
|---|
| Try MShigh |
|
|---|
| ChTry MShigh |
|
|---|
| ArgC MShigh |
|
|---|
| LysN MShigh |
|
|---|
| TryLysC MShigh |
|
|---|
General Statistics
Number of major isoforms |
Number of additional isoforms |
Number of all proteins |
Number of amino acids |
Min. Seq. Length |
Max. Seq. Length |
Avg. Seq. Length |
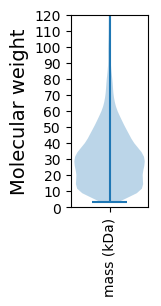
Avg. Mol. Weight |
|---|---|---|---|---|---|---|---|
0 |
1674681 |
26 |
2776 |
309.7 |
33.08 |
Amino acid frequency
Ala |
Cys |
Asp |
Glu |
Phe |
Gly |
His |
Ile |
Lys |
Leu |
|---|---|---|---|---|---|---|---|---|---|
14.621 ± 0.062 | 0.857 ± 0.009 |
6.126 ± 0.03 | 4.878 ± 0.031 |
3.478 ± 0.026 | 9.429 ± 0.036 |
2.074 ± 0.015 | 3.949 ± 0.025 |
2.472 ± 0.028 | 10.157 ± 0.034 |
Met |
Asn |
Gln |
Pro |
Arg |
Ser |
Thr |
Val |
Trp |
Tyr |
|---|---|---|---|---|---|---|---|---|---|
2.22 ± 0.015 | 1.956 ± 0.018 |
5.821 ± 0.03 | 2.469 ± 0.021 |
8.139 ± 0.041 | 5.016 ± 0.026 |
5.064 ± 0.025 | 8.073 ± 0.028 |
1.277 ± 0.014 | 1.921 ± 0.016 |
Most of the basic statistics you can see at this page can be downloaded from this CSV file
See this proteome in:

Proteome-pI is available under Creative Commons Attribution-NoDerivs license, for more details see here
| Reference: Kozlowski LP. Proteome-pI 2.0: Proteome Isoelectric Point Database Update. Nucleic Acids Res. 2021, doi: 10.1093/nar/gkab944 | Contact: Lukasz P. Kozlowski |