Roseobacter phage CRP-2
Taxonomy: Viruses; Duplodnaviria; Heunggongvirae; Uroviricota; Caudoviricetes; Caudovirales; Podoviridae; unclassified Podoviridae
Average proteome isoelectric point is 6.03
Get precalculated fractions of proteins
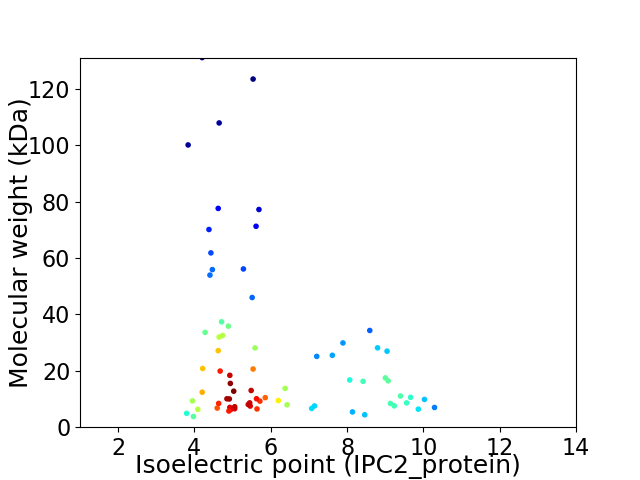
Virtual 2D-PAGE plot for 73 proteins (isoelectric point calculated using IPC2_protein)
Get csv file with sequences according to given criteria:
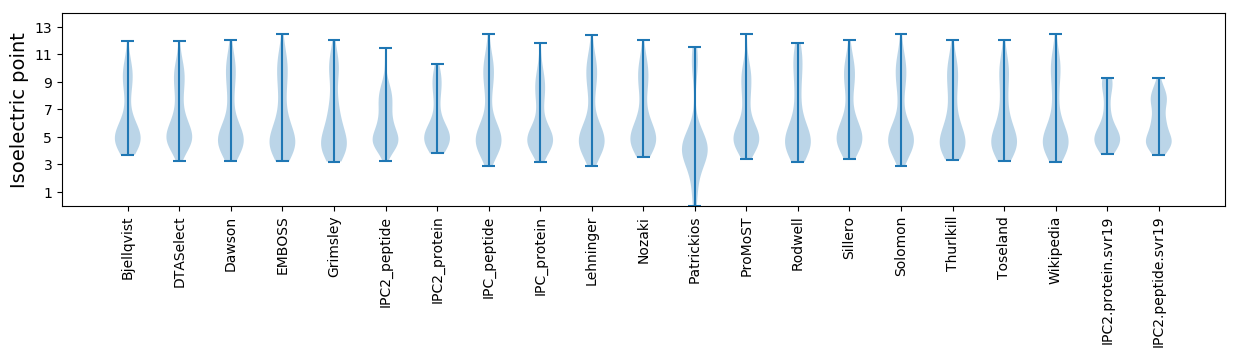
* You can choose from 21 different methods for calculating isoelectric point
Summary statistics related to proteome-wise predictions
Protein with the lowest isoelectric point:
>tr|A0A646QWW1|A0A646QWW1_9CAUD Uncharacterized protein OS=Roseobacter phage CRP-2 OX=2559281 GN=CRP2_gp36 PE=4 SV=1
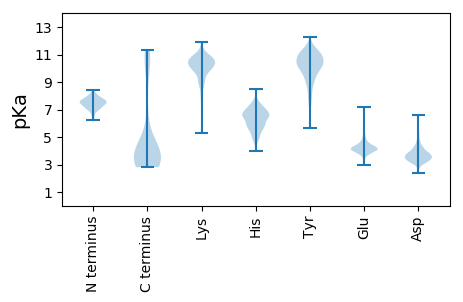
MM1 pKa = 7.5YY2 pKa = 10.4INNKK6 pKa = 9.58KK7 pKa = 10.11FDD9 pKa = 3.93SDD11 pKa = 3.36LDD13 pKa = 3.66AVYY16 pKa = 10.46DD17 pKa = 4.15GSHH20 pKa = 6.17IEE22 pKa = 4.09SWDD25 pKa = 3.26YY26 pKa = 10.75WSQGDD31 pKa = 3.63VV32 pKa = 3.09
MM1 pKa = 7.5YY2 pKa = 10.4INNKK6 pKa = 9.58KK7 pKa = 10.11FDD9 pKa = 3.93SDD11 pKa = 3.36LDD13 pKa = 3.66AVYY16 pKa = 10.46DD17 pKa = 4.15GSHH20 pKa = 6.17IEE22 pKa = 4.09SWDD25 pKa = 3.26YY26 pKa = 10.75WSQGDD31 pKa = 3.63VV32 pKa = 3.09
Molecular weight: 3.8 kDa
Isoelectric point according different methods:
Protein with the highest isoelectric point:
>tr|A0A646QVQ4|A0A646QVQ4_9CAUD Uncharacterized protein OS=Roseobacter phage CRP-2 OX=2559281 GN=CRP2_gp15 PE=4 SV=1
MM1 pKa = 7.01KK2 pKa = 9.91QKK4 pKa = 9.89TMIRR8 pKa = 11.84MMNPRR13 pKa = 11.84TGLGRR18 pKa = 11.84YY19 pKa = 6.66VKK21 pKa = 10.27RR22 pKa = 11.84VATAISVTVNVILGGSNNQTFSARR46 pKa = 11.84NHH48 pKa = 4.72QWRR51 pKa = 11.84KK52 pKa = 9.79DD53 pKa = 3.49GKK55 pKa = 8.71PNIVFLIDD63 pKa = 3.86LFLGKK68 pKa = 8.83GHH70 pKa = 7.08CLEE73 pKa = 4.69CWVYY77 pKa = 10.07WKK79 pKa = 8.98TRR81 pKa = 11.84RR82 pKa = 11.84KK83 pKa = 7.66WW84 pKa = 3.1
MM1 pKa = 7.01KK2 pKa = 9.91QKK4 pKa = 9.89TMIRR8 pKa = 11.84MMNPRR13 pKa = 11.84TGLGRR18 pKa = 11.84YY19 pKa = 6.66VKK21 pKa = 10.27RR22 pKa = 11.84VATAISVTVNVILGGSNNQTFSARR46 pKa = 11.84NHH48 pKa = 4.72QWRR51 pKa = 11.84KK52 pKa = 9.79DD53 pKa = 3.49GKK55 pKa = 8.71PNIVFLIDD63 pKa = 3.86LFLGKK68 pKa = 8.83GHH70 pKa = 7.08CLEE73 pKa = 4.69CWVYY77 pKa = 10.07WKK79 pKa = 8.98TRR81 pKa = 11.84RR82 pKa = 11.84KK83 pKa = 7.66WW84 pKa = 3.1
Molecular weight: 9.85 kDa
Isoelectric point according different methods:
Peptides (in silico digests for buttom-up proteomics)
Below you can find in silico digests of the whole proteome with Trypsin, Chymotrypsin, Trypsin+LysC, LysN, ArgC proteases suitable for different mass spec machines.| Try ESI |
 |
|---|
| ChTry ESI |
|
|---|
| ArgC ESI |
|
|---|
| LysN ESI |
|
|---|
| TryLysC ESI |
|
|---|
| Try MALDI |
|
|---|
| ChTry MALDI |
|
|---|
| ArgC MALDI |
|
|---|
| LysN MALDI |
|
|---|
| TryLysC MALDI |
|
|---|
| Try LTQ |
|
|---|
| ChTry LTQ |
|
|---|
| ArgC LTQ |
|
|---|
| LysN LTQ |
|
|---|
| TryLysC LTQ |
|
|---|
| Try MSlow |
|
|---|
| ChTry MSlow |
|
|---|
| ArgC MSlow |
|
|---|
| LysN MSlow |
|
|---|
| TryLysC MSlow |
|
|---|
| Try MShigh |
|
|---|
| ChTry MShigh |
|
|---|
| ArgC MShigh |
|
|---|
| LysN MShigh |
|
|---|
| TryLysC MShigh |
|
|---|
General Statistics
Number of major isoforms |
Number of additional isoforms |
Number of all proteins |
Number of amino acids |
Min. Seq. Length |
Max. Seq. Length |
Avg. Seq. Length |
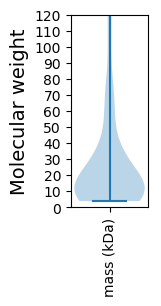
Avg. Mol. Weight |
|---|---|---|---|---|---|---|---|
0 |
17216 |
32 |
1222 |
235.8 |
26.12 |
Amino acid frequency
Ala |
Cys |
Asp |
Glu |
Phe |
Gly |
His |
Ile |
Lys |
Leu |
|---|---|---|---|---|---|---|---|---|---|
9.282 ± 0.538 | 0.807 ± 0.154 |
6.715 ± 0.22 | 6.529 ± 0.534 |
3.462 ± 0.18 | 7.278 ± 0.439 |
1.626 ± 0.207 | 5.106 ± 0.194 |
6.186 ± 0.503 | 6.837 ± 0.26 |
Met |
Asn |
Gln |
Pro |
Arg |
Ser |
Thr |
Val |
Trp |
Tyr |
|---|---|---|---|---|---|---|---|---|---|
3.049 ± 0.19 | 4.978 ± 0.272 |
3.793 ± 0.297 | 4.31 ± 0.503 |
4.397 ± 0.316 | 6.36 ± 0.5 |
7.388 ± 0.68 | 6.709 ± 0.218 |
1.324 ± 0.144 | 3.863 ± 0.253 |
Most of the basic statistics you can see at this page can be downloaded from this CSV file
See this proteome in:

Proteome-pI is available under Creative Commons Attribution-NoDerivs license, for more details see here
| Reference: Kozlowski LP. Proteome-pI 2.0: Proteome Isoelectric Point Database Update. Nucleic Acids Res. 2021, doi: 10.1093/nar/gkab944 | Contact: Lukasz P. Kozlowski |