Apibacter mensalis
Taxonomy: cellular organisms; Bacteria; FCB group; Bacteroidetes/Chlorobi group; Bacteroidetes; Flavobacteriia; Flavobacteriales; Weeksellaceae; Apibacter
Average proteome isoelectric point is 7.11
Get precalculated fractions of proteins
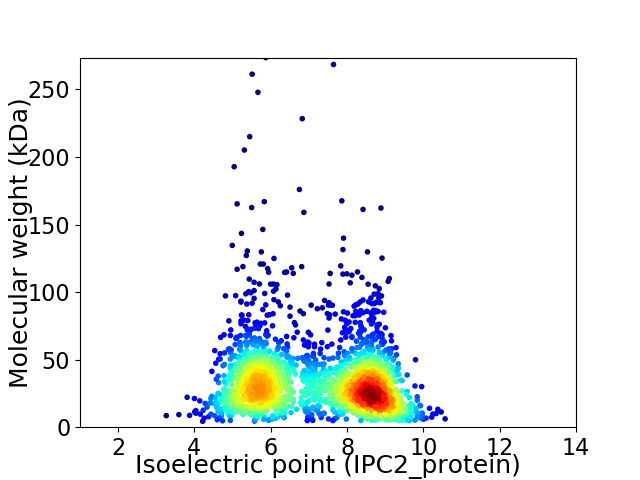
Virtual 2D-PAGE plot for 2083 proteins (isoelectric point calculated using IPC2_protein)
Get csv file with sequences according to given criteria:
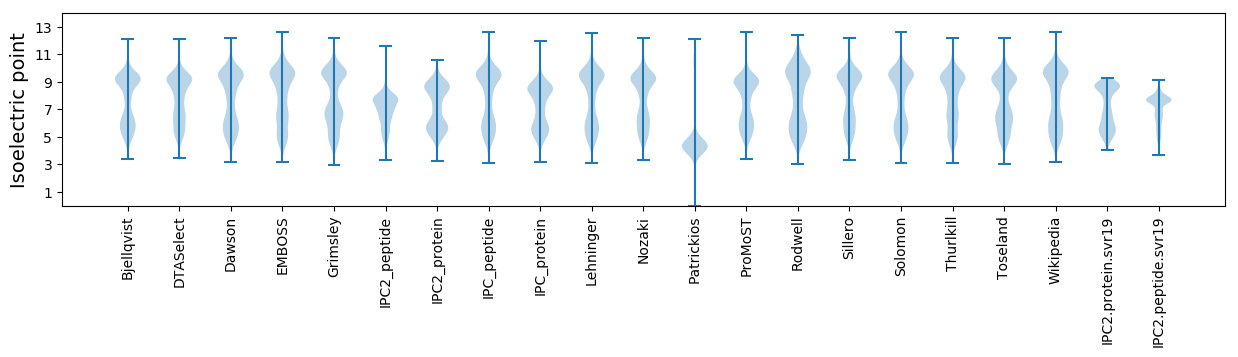
* You can choose from 21 different methods for calculating isoelectric point
Summary statistics related to proteome-wise predictions
Protein with the lowest isoelectric point:
>tr|A0A110BK62|A0A110BK62_9FLAO Intein N-terminal splicing region OS=Apibacter mensalis OX=1586267 GN=Ga0061079_104118 PE=4 SV=1
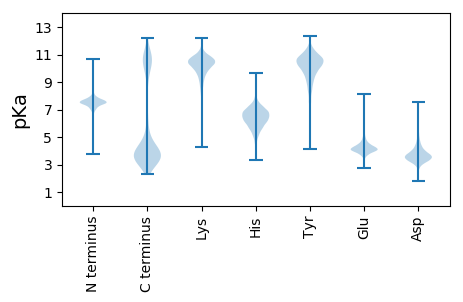
MM1 pKa = 7.67TIYY4 pKa = 10.28EE5 pKa = 4.29LSIDD9 pKa = 3.91GDD11 pKa = 3.89NATSLDD17 pKa = 3.95FPIQDD22 pKa = 3.5EE23 pKa = 4.45QEE25 pKa = 4.19QFLLLAEE32 pKa = 4.29EE33 pKa = 5.2KK34 pKa = 9.34ITNNLSVKK42 pKa = 10.25AQWQEE47 pKa = 3.52FLVLKK52 pKa = 10.44KK53 pKa = 10.39EE54 pKa = 4.3PKK56 pKa = 9.54IDD58 pKa = 3.55MDD60 pKa = 4.29FNDD63 pKa = 3.79INDD66 pKa = 3.39IGVYY70 pKa = 9.96IISPRR75 pKa = 11.84AYY77 pKa = 9.76EE78 pKa = 3.97LLHH81 pKa = 6.49PLFDD85 pKa = 5.25DD86 pKa = 3.86SVEE89 pKa = 4.06VLPLKK94 pKa = 10.71SDD96 pKa = 3.53DD97 pKa = 3.48GTYY100 pKa = 10.82FLLNIIQTTDD110 pKa = 3.36CLDD113 pKa = 3.85KK114 pKa = 11.2EE115 pKa = 4.42NSVYY119 pKa = 10.07TALPGGQILEE129 pKa = 4.24YY130 pKa = 9.79EE131 pKa = 4.48NLSIDD136 pKa = 3.9PQKK139 pKa = 9.67ITCPLFRR146 pKa = 11.84IPEE149 pKa = 4.03LPYY152 pKa = 10.18TVLITDD158 pKa = 3.99QIQDD162 pKa = 2.83IFYY165 pKa = 9.46SHH167 pKa = 5.95QLKK170 pKa = 10.45GLHH173 pKa = 4.93FTEE176 pKa = 4.76NEE178 pKa = 4.06FVTSDD183 pKa = 3.25FF184 pKa = 4.09
MM1 pKa = 7.67TIYY4 pKa = 10.28EE5 pKa = 4.29LSIDD9 pKa = 3.91GDD11 pKa = 3.89NATSLDD17 pKa = 3.95FPIQDD22 pKa = 3.5EE23 pKa = 4.45QEE25 pKa = 4.19QFLLLAEE32 pKa = 4.29EE33 pKa = 5.2KK34 pKa = 9.34ITNNLSVKK42 pKa = 10.25AQWQEE47 pKa = 3.52FLVLKK52 pKa = 10.44KK53 pKa = 10.39EE54 pKa = 4.3PKK56 pKa = 9.54IDD58 pKa = 3.55MDD60 pKa = 4.29FNDD63 pKa = 3.79INDD66 pKa = 3.39IGVYY70 pKa = 9.96IISPRR75 pKa = 11.84AYY77 pKa = 9.76EE78 pKa = 3.97LLHH81 pKa = 6.49PLFDD85 pKa = 5.25DD86 pKa = 3.86SVEE89 pKa = 4.06VLPLKK94 pKa = 10.71SDD96 pKa = 3.53DD97 pKa = 3.48GTYY100 pKa = 10.82FLLNIIQTTDD110 pKa = 3.36CLDD113 pKa = 3.85KK114 pKa = 11.2EE115 pKa = 4.42NSVYY119 pKa = 10.07TALPGGQILEE129 pKa = 4.24YY130 pKa = 9.79EE131 pKa = 4.48NLSIDD136 pKa = 3.9PQKK139 pKa = 9.67ITCPLFRR146 pKa = 11.84IPEE149 pKa = 4.03LPYY152 pKa = 10.18TVLITDD158 pKa = 3.99QIQDD162 pKa = 2.83IFYY165 pKa = 9.46SHH167 pKa = 5.95QLKK170 pKa = 10.45GLHH173 pKa = 4.93FTEE176 pKa = 4.76NEE178 pKa = 4.06FVTSDD183 pKa = 3.25FF184 pKa = 4.09
Molecular weight: 21.22 kDa
Isoelectric point according different methods:
Protein with the highest isoelectric point:
>tr|A0A0X3APA2|A0A0X3APA2_9FLAO Deoxyuridine 5'-triphosphate nucleotidohydrolase OS=Apibacter mensalis OX=1586267 GN=dut PE=3 SV=1
MM1 pKa = 7.54SVRR4 pKa = 11.84KK5 pKa = 9.68LKK7 pKa = 10.5PITPGQRR14 pKa = 11.84FRR16 pKa = 11.84IVNNFEE22 pKa = 4.71EE23 pKa = 4.61ITTSKK28 pKa = 10.54PEE30 pKa = 3.67KK31 pKa = 10.07SLLRR35 pKa = 11.84GISKK39 pKa = 10.57SGGRR43 pKa = 11.84NNSGKK48 pKa = 8.25MTMRR52 pKa = 11.84YY53 pKa = 7.81TGGGHH58 pKa = 6.19KK59 pKa = 9.81KK60 pKa = 9.9RR61 pKa = 11.84YY62 pKa = 9.52RR63 pKa = 11.84EE64 pKa = 3.64IDD66 pKa = 3.38FKK68 pKa = 11.17RR69 pKa = 11.84NKK71 pKa = 9.89FGIPATVKK79 pKa = 10.48SVEE82 pKa = 3.91YY83 pKa = 10.55DD84 pKa = 3.39PNRR87 pKa = 11.84TAFIALLVYY96 pKa = 10.85ADD98 pKa = 3.54GEE100 pKa = 4.0KK101 pKa = 10.23RR102 pKa = 11.84YY103 pKa = 9.71IVSPHH108 pKa = 6.44GIKK111 pKa = 10.33VGQKK115 pKa = 8.2VVSGEE120 pKa = 4.14SVAPEE125 pKa = 3.68IGNAMKK131 pKa = 10.68LKK133 pKa = 10.01NIPLGTVISCIEE145 pKa = 3.9LRR147 pKa = 11.84PGQGAKK153 pKa = 8.51MARR156 pKa = 11.84SAGTSAQLIARR167 pKa = 11.84DD168 pKa = 3.38GKK170 pKa = 10.41YY171 pKa = 10.39AVLKK175 pKa = 9.42MPSGEE180 pKa = 3.74TRR182 pKa = 11.84MILVEE187 pKa = 4.22CMATIGSVSNSDD199 pKa = 2.99HH200 pKa = 5.87QLIVSGKK207 pKa = 8.58AGRR210 pKa = 11.84SRR212 pKa = 11.84WLGRR216 pKa = 11.84RR217 pKa = 11.84PRR219 pKa = 11.84TRR221 pKa = 11.84PVAMNPVDD229 pKa = 3.63HH230 pKa = 7.13PMGGGEE236 pKa = 4.0GRR238 pKa = 11.84STGGHH243 pKa = 5.23PRR245 pKa = 11.84SRR247 pKa = 11.84KK248 pKa = 9.07GMPAKK253 pKa = 10.34GYY255 pKa = 7.47KK256 pKa = 8.79TRR258 pKa = 11.84SKK260 pKa = 10.53KK261 pKa = 10.32KK262 pKa = 8.79EE263 pKa = 3.86SNRR266 pKa = 11.84YY267 pKa = 8.71ILQKK271 pKa = 10.66RR272 pKa = 11.84KK273 pKa = 9.96
MM1 pKa = 7.54SVRR4 pKa = 11.84KK5 pKa = 9.68LKK7 pKa = 10.5PITPGQRR14 pKa = 11.84FRR16 pKa = 11.84IVNNFEE22 pKa = 4.71EE23 pKa = 4.61ITTSKK28 pKa = 10.54PEE30 pKa = 3.67KK31 pKa = 10.07SLLRR35 pKa = 11.84GISKK39 pKa = 10.57SGGRR43 pKa = 11.84NNSGKK48 pKa = 8.25MTMRR52 pKa = 11.84YY53 pKa = 7.81TGGGHH58 pKa = 6.19KK59 pKa = 9.81KK60 pKa = 9.9RR61 pKa = 11.84YY62 pKa = 9.52RR63 pKa = 11.84EE64 pKa = 3.64IDD66 pKa = 3.38FKK68 pKa = 11.17RR69 pKa = 11.84NKK71 pKa = 9.89FGIPATVKK79 pKa = 10.48SVEE82 pKa = 3.91YY83 pKa = 10.55DD84 pKa = 3.39PNRR87 pKa = 11.84TAFIALLVYY96 pKa = 10.85ADD98 pKa = 3.54GEE100 pKa = 4.0KK101 pKa = 10.23RR102 pKa = 11.84YY103 pKa = 9.71IVSPHH108 pKa = 6.44GIKK111 pKa = 10.33VGQKK115 pKa = 8.2VVSGEE120 pKa = 4.14SVAPEE125 pKa = 3.68IGNAMKK131 pKa = 10.68LKK133 pKa = 10.01NIPLGTVISCIEE145 pKa = 3.9LRR147 pKa = 11.84PGQGAKK153 pKa = 8.51MARR156 pKa = 11.84SAGTSAQLIARR167 pKa = 11.84DD168 pKa = 3.38GKK170 pKa = 10.41YY171 pKa = 10.39AVLKK175 pKa = 9.42MPSGEE180 pKa = 3.74TRR182 pKa = 11.84MILVEE187 pKa = 4.22CMATIGSVSNSDD199 pKa = 2.99HH200 pKa = 5.87QLIVSGKK207 pKa = 8.58AGRR210 pKa = 11.84SRR212 pKa = 11.84WLGRR216 pKa = 11.84RR217 pKa = 11.84PRR219 pKa = 11.84TRR221 pKa = 11.84PVAMNPVDD229 pKa = 3.63HH230 pKa = 7.13PMGGGEE236 pKa = 4.0GRR238 pKa = 11.84STGGHH243 pKa = 5.23PRR245 pKa = 11.84SRR247 pKa = 11.84KK248 pKa = 9.07GMPAKK253 pKa = 10.34GYY255 pKa = 7.47KK256 pKa = 8.79TRR258 pKa = 11.84SKK260 pKa = 10.53KK261 pKa = 10.32KK262 pKa = 8.79EE263 pKa = 3.86SNRR266 pKa = 11.84YY267 pKa = 8.71ILQKK271 pKa = 10.66RR272 pKa = 11.84KK273 pKa = 9.96
Molecular weight: 30.02 kDa
Isoelectric point according different methods:
Peptides (in silico digests for buttom-up proteomics)
Below you can find in silico digests of the whole proteome with Trypsin, Chymotrypsin, Trypsin+LysC, LysN, ArgC proteases suitable for different mass spec machines.| Try ESI |
 |
|---|
| ChTry ESI |
|
|---|
| ArgC ESI |
|
|---|
| LysN ESI |
|
|---|
| TryLysC ESI |
|
|---|
| Try MALDI |
|
|---|
| ChTry MALDI |
|
|---|
| ArgC MALDI |
|
|---|
| LysN MALDI |
|
|---|
| TryLysC MALDI |
|
|---|
| Try LTQ |
|
|---|
| ChTry LTQ |
|
|---|
| ArgC LTQ |
|
|---|
| LysN LTQ |
|
|---|
| TryLysC LTQ |
|
|---|
| Try MSlow |
|
|---|
| ChTry MSlow |
|
|---|
| ArgC MSlow |
|
|---|
| LysN MSlow |
|
|---|
| TryLysC MSlow |
|
|---|
| Try MShigh |
|
|---|
| ChTry MShigh |
|
|---|
| ArgC MShigh |
|
|---|
| LysN MShigh |
|
|---|
| TryLysC MShigh |
|
|---|
General Statistics
Number of major isoforms |
Number of additional isoforms |
Number of all proteins |
Number of amino acids |
Min. Seq. Length |
Max. Seq. Length |
Avg. Seq. Length |
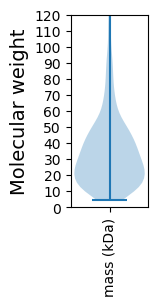
Avg. Mol. Weight |
|---|---|---|---|---|---|---|---|
0 |
668283 |
39 |
2439 |
320.8 |
36.52 |
Amino acid frequency
Ala |
Cys |
Asp |
Glu |
Phe |
Gly |
His |
Ile |
Lys |
Leu |
|---|---|---|---|---|---|---|---|---|---|
5.24 ± 0.053 | 0.835 ± 0.017 |
5.112 ± 0.036 | 6.517 ± 0.054 |
5.134 ± 0.045 | 6.101 ± 0.056 |
1.742 ± 0.019 | 9.389 ± 0.061 |
8.924 ± 0.05 | 9.427 ± 0.055 |
Met |
Asn |
Gln |
Pro |
Arg |
Ser |
Thr |
Val |
Trp |
Tyr |
|---|---|---|---|---|---|---|---|---|---|
2.104 ± 0.02 | 6.518 ± 0.055 |
3.304 ± 0.03 | 3.345 ± 0.026 |
3.248 ± 0.029 | 6.754 ± 0.043 |
5.243 ± 0.039 | 5.469 ± 0.038 |
0.985 ± 0.017 | 4.607 ± 0.04 |
Most of the basic statistics you can see at this page can be downloaded from this CSV file
See this proteome in:

Proteome-pI is available under Creative Commons Attribution-NoDerivs license, for more details see here
| Reference: Kozlowski LP. Proteome-pI 2.0: Proteome Isoelectric Point Database Update. Nucleic Acids Res. 2021, doi: 10.1093/nar/gkab944 | Contact: Lukasz P. Kozlowski |