Pseudoalteromonas phage H101
Taxonomy: Viruses; Duplodnaviria; Heunggongvirae; Uroviricota; Caudoviricetes; Caudovirales; Myoviridae; Shandongvirus; Pseudoalteromonas virus H101
Average proteome isoelectric point is 5.76
Get precalculated fractions of proteins
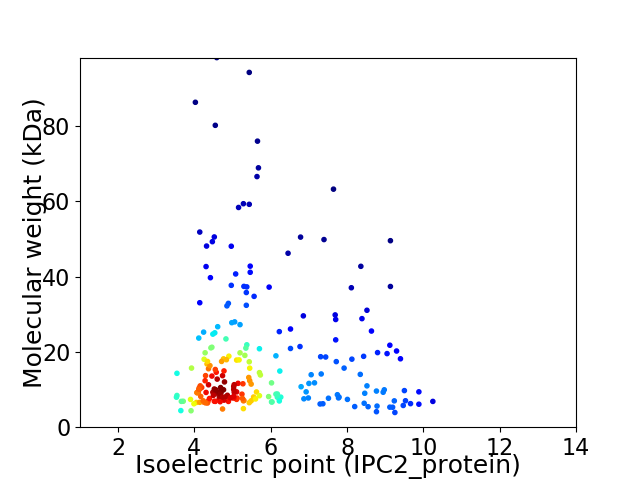
Virtual 2D-PAGE plot for 228 proteins (isoelectric point calculated using IPC2_protein)
Get csv file with sequences according to given criteria:
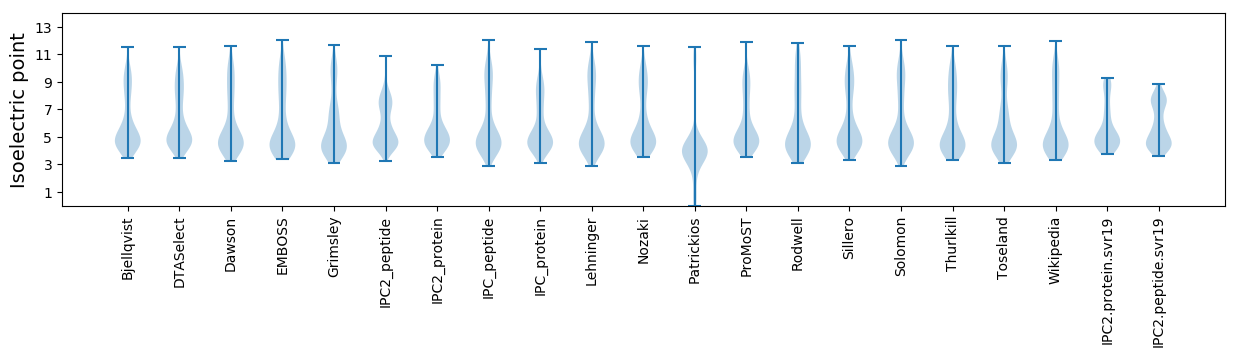
* You can choose from 21 different methods for calculating isoelectric point
Summary statistics related to proteome-wise predictions
Protein with the lowest isoelectric point:
>tr|A0A0H4J256|A0A0H4J256_9CAUD Uncharacterized protein OS=Pseudoalteromonas phage H101 OX=1654919 PE=4 SV=1
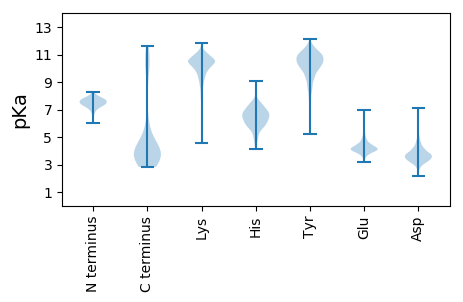
MM1 pKa = 7.46HH2 pKa = 7.75LVTNINGYY10 pKa = 9.36NMEE13 pKa = 4.27SLEE16 pKa = 4.24SIIYY20 pKa = 10.33SRR22 pKa = 11.84TGLNSVDD29 pKa = 4.08QLVDD33 pKa = 3.5DD34 pKa = 5.43LGIDD38 pKa = 3.58EE39 pKa = 4.7
MM1 pKa = 7.46HH2 pKa = 7.75LVTNINGYY10 pKa = 9.36NMEE13 pKa = 4.27SLEE16 pKa = 4.24SIIYY20 pKa = 10.33SRR22 pKa = 11.84TGLNSVDD29 pKa = 4.08QLVDD33 pKa = 3.5DD34 pKa = 5.43LGIDD38 pKa = 3.58EE39 pKa = 4.7
Molecular weight: 4.37 kDa
Isoelectric point according different methods:
Protein with the highest isoelectric point:
>tr|A0A0H4INW5|A0A0H4INW5_9CAUD Adenine-specific methyltransferase OS=Pseudoalteromonas phage H101 OX=1654919 PE=4 SV=1
MM1 pKa = 6.12ITARR5 pKa = 11.84IIFKK9 pKa = 9.9RR10 pKa = 11.84DD11 pKa = 2.86QSGYY15 pKa = 8.9IKK17 pKa = 10.47PSITRR22 pKa = 11.84PFSMYY27 pKa = 10.84SDD29 pKa = 2.79IKK31 pKa = 10.23TFIRR35 pKa = 11.84ANKK38 pKa = 8.54DD39 pKa = 3.1TVLKK43 pKa = 10.93VVDD46 pKa = 4.3RR47 pKa = 11.84YY48 pKa = 10.39GVRR51 pKa = 11.84II52 pKa = 3.73
MM1 pKa = 6.12ITARR5 pKa = 11.84IIFKK9 pKa = 9.9RR10 pKa = 11.84DD11 pKa = 2.86QSGYY15 pKa = 8.9IKK17 pKa = 10.47PSITRR22 pKa = 11.84PFSMYY27 pKa = 10.84SDD29 pKa = 2.79IKK31 pKa = 10.23TFIRR35 pKa = 11.84ANKK38 pKa = 8.54DD39 pKa = 3.1TVLKK43 pKa = 10.93VVDD46 pKa = 4.3RR47 pKa = 11.84YY48 pKa = 10.39GVRR51 pKa = 11.84II52 pKa = 3.73
Molecular weight: 6.11 kDa
Isoelectric point according different methods:
Peptides (in silico digests for buttom-up proteomics)
Below you can find in silico digests of the whole proteome with Trypsin, Chymotrypsin, Trypsin+LysC, LysN, ArgC proteases suitable for different mass spec machines.| Try ESI |
 |
|---|
| ChTry ESI |
|
|---|
| ArgC ESI |
|
|---|
| LysN ESI |
|
|---|
| TryLysC ESI |
|
|---|
| Try MALDI |
|
|---|
| ChTry MALDI |
|
|---|
| ArgC MALDI |
|
|---|
| LysN MALDI |
|
|---|
| TryLysC MALDI |
|
|---|
| Try LTQ |
|
|---|
| ChTry LTQ |
|
|---|
| ArgC LTQ |
|
|---|
| LysN LTQ |
|
|---|
| TryLysC LTQ |
|
|---|
| Try MSlow |
|
|---|
| ChTry MSlow |
|
|---|
| ArgC MSlow |
|
|---|
| LysN MSlow |
|
|---|
| TryLysC MSlow |
|
|---|
| Try MShigh |
|
|---|
| ChTry MShigh |
|
|---|
| ArgC MShigh |
|
|---|
| LysN MShigh |
|
|---|
| TryLysC MShigh |
|
|---|
General Statistics
Number of major isoforms |
Number of additional isoforms |
Number of all proteins |
Number of amino acids |
Min. Seq. Length |
Max. Seq. Length |
Avg. Seq. Length |
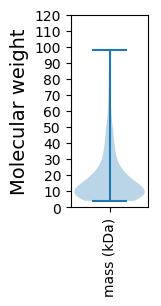
Avg. Mol. Weight |
|---|---|---|---|---|---|---|---|
0 |
37698 |
37 |
917 |
165.3 |
18.8 |
Amino acid frequency
Ala |
Cys |
Asp |
Glu |
Phe |
Gly |
His |
Ile |
Lys |
Leu |
|---|---|---|---|---|---|---|---|---|---|
5.364 ± 0.228 | 1.483 ± 0.109 |
6.756 ± 0.115 | 7.671 ± 0.217 |
4.09 ± 0.112 | 6.6 ± 0.219 |
1.804 ± 0.095 | 5.984 ± 0.132 |
7.605 ± 0.282 | 8.435 ± 0.176 |
Met |
Asn |
Gln |
Pro |
Arg |
Ser |
Thr |
Val |
Trp |
Tyr |
|---|---|---|---|---|---|---|---|---|---|
2.414 ± 0.109 | 5.48 ± 0.157 |
2.881 ± 0.104 | 3.531 ± 0.119 |
3.841 ± 0.106 | 6.783 ± 0.191 |
5.968 ± 0.209 | 6.984 ± 0.148 |
1.454 ± 0.064 | 4.87 ± 0.142 |
Most of the basic statistics you can see at this page can be downloaded from this CSV file
See this proteome in:

Proteome-pI is available under Creative Commons Attribution-NoDerivs license, for more details see here
| Reference: Kozlowski LP. Proteome-pI 2.0: Proteome Isoelectric Point Database Update. Nucleic Acids Res. 2021, doi: 10.1093/nar/gkab944 | Contact: Lukasz P. Kozlowski |