Streptomyces phage SF3
Taxonomy: Viruses; Duplodnaviria; Heunggongvirae; Uroviricota; Caudoviricetes; Caudovirales; Siphoviridae; unclassified Siphoviridae
Average proteome isoelectric point is 6.17
Get precalculated fractions of proteins
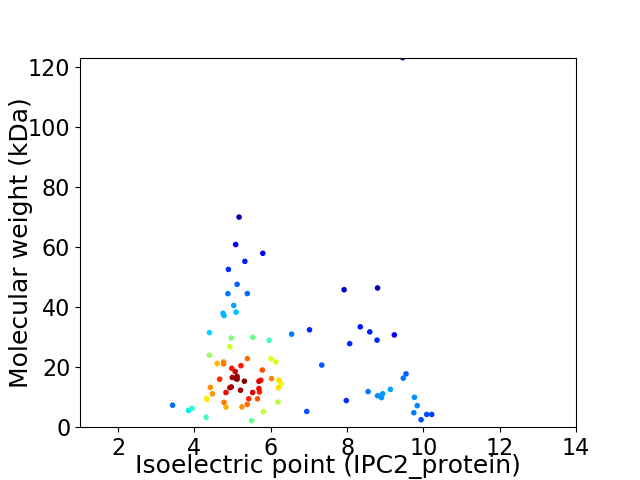
Virtual 2D-PAGE plot for 90 proteins (isoelectric point calculated using IPC2_protein)
Get csv file with sequences according to given criteria:
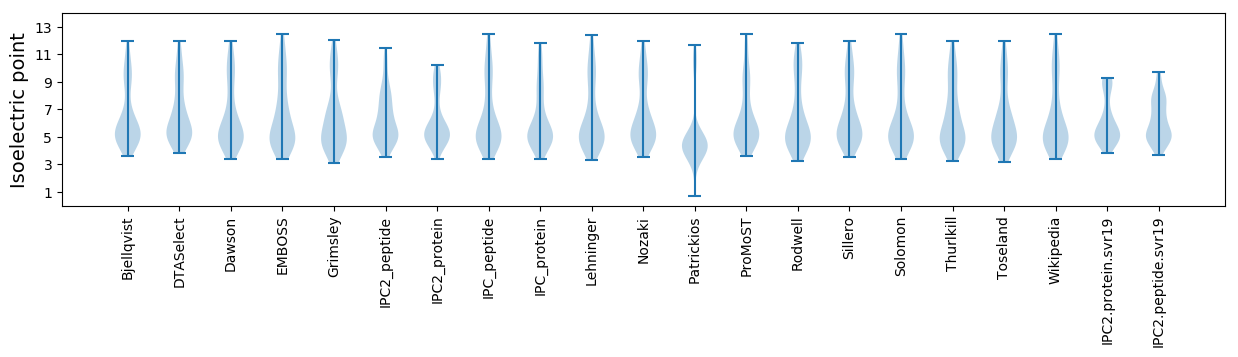
* You can choose from 21 different methods for calculating isoelectric point
Summary statistics related to proteome-wise predictions
Protein with the lowest isoelectric point:
>tr|A0A0M4S3G8|A0A0M4S3G8_9CAUD Phage_Mu_F domain-containing protein OS=Streptomyces phage SF3 OX=1690818 GN=SF3_840 PE=4 SV=1
MM1 pKa = 7.64SDD3 pKa = 4.14EE4 pKa = 4.39FAPDD8 pKa = 3.51CGAVTPEE15 pKa = 4.32EE16 pKa = 4.12EE17 pKa = 4.33CGEE20 pKa = 4.26CEE22 pKa = 4.38SCFEE26 pKa = 4.16ATAEE30 pKa = 4.75GIDD33 pKa = 3.45RR34 pKa = 11.84AVEE37 pKa = 4.24SGSMTASEE45 pKa = 3.93AAEE48 pKa = 3.78AHH50 pKa = 6.57DD51 pKa = 5.19LNGTYY56 pKa = 9.93RR57 pKa = 11.84RR58 pKa = 11.84EE59 pKa = 3.91
MM1 pKa = 7.64SDD3 pKa = 4.14EE4 pKa = 4.39FAPDD8 pKa = 3.51CGAVTPEE15 pKa = 4.32EE16 pKa = 4.12EE17 pKa = 4.33CGEE20 pKa = 4.26CEE22 pKa = 4.38SCFEE26 pKa = 4.16ATAEE30 pKa = 4.75GIDD33 pKa = 3.45RR34 pKa = 11.84AVEE37 pKa = 4.24SGSMTASEE45 pKa = 3.93AAEE48 pKa = 3.78AHH50 pKa = 6.57DD51 pKa = 5.19LNGTYY56 pKa = 9.93RR57 pKa = 11.84RR58 pKa = 11.84EE59 pKa = 3.91
Molecular weight: 6.26 kDa
Isoelectric point according different methods:
Protein with the highest isoelectric point:
>tr|A0A0M5M0T6|A0A0M5M0T6_9CAUD Uncharacterized protein OS=Streptomyces phage SF3 OX=1690818 GN=SF3_70 PE=4 SV=1
MM1 pKa = 7.58INFIADD7 pKa = 3.77LTSALYY13 pKa = 10.25AAFCAFVLAAQAMTPLFPYY32 pKa = 10.17HH33 pKa = 6.22VALTLSIFITLAGGLIGWSWRR54 pKa = 11.84RR55 pKa = 11.84SIWRR59 pKa = 11.84LFGRR63 pKa = 11.84KK64 pKa = 7.95
MM1 pKa = 7.58INFIADD7 pKa = 3.77LTSALYY13 pKa = 10.25AAFCAFVLAAQAMTPLFPYY32 pKa = 10.17HH33 pKa = 6.22VALTLSIFITLAGGLIGWSWRR54 pKa = 11.84RR55 pKa = 11.84SIWRR59 pKa = 11.84LFGRR63 pKa = 11.84KK64 pKa = 7.95
Molecular weight: 7.18 kDa
Isoelectric point according different methods:
Peptides (in silico digests for buttom-up proteomics)
Below you can find in silico digests of the whole proteome with Trypsin, Chymotrypsin, Trypsin+LysC, LysN, ArgC proteases suitable for different mass spec machines.| Try ESI |
 |
|---|
| ChTry ESI |
|
|---|
| ArgC ESI |
|
|---|
| LysN ESI |
|
|---|
| TryLysC ESI |
|
|---|
| Try MALDI |
|
|---|
| ChTry MALDI |
|
|---|
| ArgC MALDI |
|
|---|
| LysN MALDI |
|
|---|
| TryLysC MALDI |
|
|---|
| Try LTQ |
|
|---|
| ChTry LTQ |
|
|---|
| ArgC LTQ |
|
|---|
| LysN LTQ |
|
|---|
| TryLysC LTQ |
|
|---|
| Try MSlow |
|
|---|
| ChTry MSlow |
|
|---|
| ArgC MSlow |
|
|---|
| LysN MSlow |
|
|---|
| TryLysC MSlow |
|
|---|
| Try MShigh |
|
|---|
| ChTry MShigh |
|
|---|
| ArgC MShigh |
|
|---|
| LysN MShigh |
|
|---|
| TryLysC MShigh |
|
|---|
General Statistics
Number of major isoforms |
Number of additional isoforms |
Number of all proteins |
Number of amino acids |
Min. Seq. Length |
Max. Seq. Length |
Avg. Seq. Length |
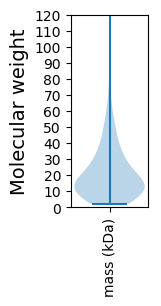
Avg. Mol. Weight |
|---|---|---|---|---|---|---|---|
0 |
18079 |
20 |
1190 |
200.9 |
21.77 |
Amino acid frequency
Ala |
Cys |
Asp |
Glu |
Phe |
Gly |
His |
Ile |
Lys |
Leu |
|---|---|---|---|---|---|---|---|---|---|
13.27 ± 0.332 | 1.034 ± 0.136 |
7.019 ± 0.257 | 5.824 ± 0.362 |
2.074 ± 0.146 | 8.817 ± 0.526 |
2.318 ± 0.236 | 3.8 ± 0.174 |
2.965 ± 0.27 | 8.203 ± 0.268 |
Met |
Asn |
Gln |
Pro |
Arg |
Ser |
Thr |
Val |
Trp |
Tyr |
|---|---|---|---|---|---|---|---|---|---|
1.903 ± 0.101 | 2.295 ± 0.203 |
6.272 ± 0.292 | 3.075 ± 0.212 |
8.236 ± 0.371 | 4.762 ± 0.229 |
6.084 ± 0.249 | 7.65 ± 0.216 |
1.991 ± 0.127 | 2.406 ± 0.115 |
Most of the basic statistics you can see at this page can be downloaded from this CSV file
See this proteome in:

Proteome-pI is available under Creative Commons Attribution-NoDerivs license, for more details see here
| Reference: Kozlowski LP. Proteome-pI 2.0: Proteome Isoelectric Point Database Update. Nucleic Acids Res. 2021, doi: 10.1093/nar/gkab944 | Contact: Lukasz P. Kozlowski |