Epibacterium ulvae
Taxonomy: cellular organisms; Bacteria; Proteobacteria; Alphaproteobacteria; Rhodobacterales; Roseobacteraceae; Epibacterium
Average proteome isoelectric point is 6.09
Get precalculated fractions of proteins
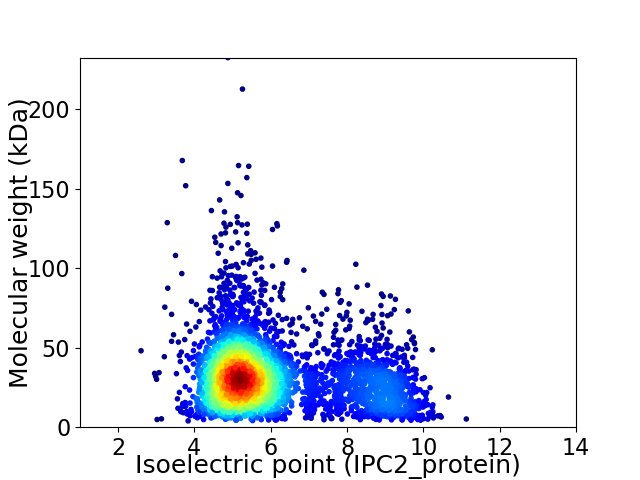
Virtual 2D-PAGE plot for 3832 proteins (isoelectric point calculated using IPC2_protein)
Get csv file with sequences according to given criteria:
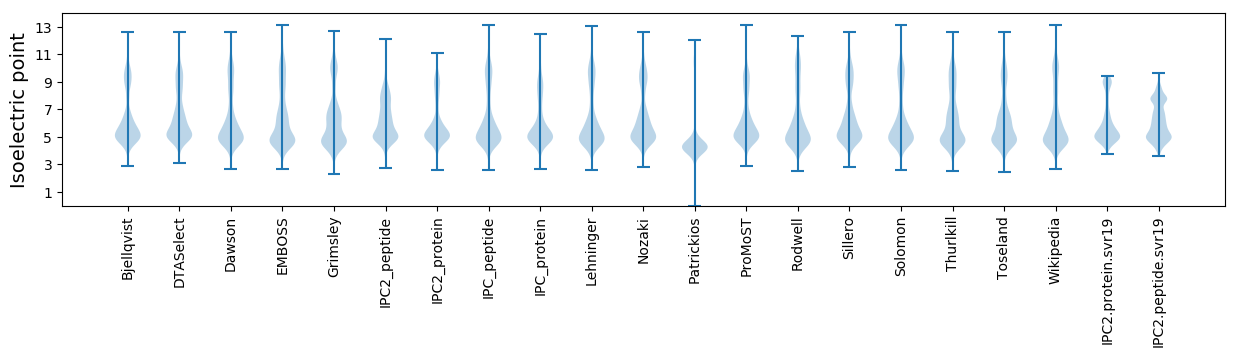
* You can choose from 21 different methods for calculating isoelectric point
Summary statistics related to proteome-wise predictions
Protein with the lowest isoelectric point:
>tr|A0A1G5QT75|A0A1G5QT75_9RHOB Hemoglobin/transferrin/lactoferrin receptor protein OS=Epibacterium ulvae OX=1156985 GN=SAMN04488118_105310 PE=3 SV=1
MM1 pKa = 7.29VFFGILCGMVFGGITALTGVISFDD25 pKa = 3.41FSIWVALASYY35 pKa = 10.52SVVGSTAAVITTVTLYY51 pKa = 10.67AWSSSDD57 pKa = 5.66DD58 pKa = 3.54DD59 pKa = 3.84WSDD62 pKa = 3.57YY63 pKa = 11.56DD64 pKa = 4.36DD65 pKa = 4.79NSRR68 pKa = 11.84KK69 pKa = 9.87DD70 pKa = 3.41DD71 pKa = 3.69SLEE74 pKa = 3.92LFGSHH79 pKa = 7.1EE80 pKa = 4.18IDD82 pKa = 3.61DD83 pKa = 4.13QKK85 pKa = 11.45VGSSIAAA92 pKa = 3.53
MM1 pKa = 7.29VFFGILCGMVFGGITALTGVISFDD25 pKa = 3.41FSIWVALASYY35 pKa = 10.52SVVGSTAAVITTVTLYY51 pKa = 10.67AWSSSDD57 pKa = 5.66DD58 pKa = 3.54DD59 pKa = 3.84WSDD62 pKa = 3.57YY63 pKa = 11.56DD64 pKa = 4.36DD65 pKa = 4.79NSRR68 pKa = 11.84KK69 pKa = 9.87DD70 pKa = 3.41DD71 pKa = 3.69SLEE74 pKa = 3.92LFGSHH79 pKa = 7.1EE80 pKa = 4.18IDD82 pKa = 3.61DD83 pKa = 4.13QKK85 pKa = 11.45VGSSIAAA92 pKa = 3.53
Molecular weight: 9.84 kDa
Isoelectric point according different methods:
Protein with the highest isoelectric point:
>tr|A0A1G5RJ14|A0A1G5RJ14_9RHOB Flagellar L-ring protein OS=Epibacterium ulvae OX=1156985 GN=flgH PE=3 SV=1
MM1 pKa = 7.35KK2 pKa = 9.44RR3 pKa = 11.84TYY5 pKa = 10.31QPSNLVRR12 pKa = 11.84KK13 pKa = 9.18RR14 pKa = 11.84RR15 pKa = 11.84HH16 pKa = 4.42GFRR19 pKa = 11.84ARR21 pKa = 11.84MATKK25 pKa = 10.37AGRR28 pKa = 11.84KK29 pKa = 8.54ILNARR34 pKa = 11.84RR35 pKa = 11.84ARR37 pKa = 11.84GRR39 pKa = 11.84KK40 pKa = 9.07SLSAA44 pKa = 3.93
MM1 pKa = 7.35KK2 pKa = 9.44RR3 pKa = 11.84TYY5 pKa = 10.31QPSNLVRR12 pKa = 11.84KK13 pKa = 9.18RR14 pKa = 11.84RR15 pKa = 11.84HH16 pKa = 4.42GFRR19 pKa = 11.84ARR21 pKa = 11.84MATKK25 pKa = 10.37AGRR28 pKa = 11.84KK29 pKa = 8.54ILNARR34 pKa = 11.84RR35 pKa = 11.84ARR37 pKa = 11.84GRR39 pKa = 11.84KK40 pKa = 9.07SLSAA44 pKa = 3.93
Molecular weight: 5.15 kDa
Isoelectric point according different methods:
Peptides (in silico digests for buttom-up proteomics)
Below you can find in silico digests of the whole proteome with Trypsin, Chymotrypsin, Trypsin+LysC, LysN, ArgC proteases suitable for different mass spec machines.| Try ESI |
 |
|---|
| ChTry ESI |
|
|---|
| ArgC ESI |
|
|---|
| LysN ESI |
|
|---|
| TryLysC ESI |
|
|---|
| Try MALDI |
|
|---|
| ChTry MALDI |
|
|---|
| ArgC MALDI |
|
|---|
| LysN MALDI |
|
|---|
| TryLysC MALDI |
|
|---|
| Try LTQ |
|
|---|
| ChTry LTQ |
|
|---|
| ArgC LTQ |
|
|---|
| LysN LTQ |
|
|---|
| TryLysC LTQ |
|
|---|
| Try MSlow |
|
|---|
| ChTry MSlow |
|
|---|
| ArgC MSlow |
|
|---|
| LysN MSlow |
|
|---|
| TryLysC MSlow |
|
|---|
| Try MShigh |
|
|---|
| ChTry MShigh |
|
|---|
| ArgC MShigh |
|
|---|
| LysN MShigh |
|
|---|
| TryLysC MShigh |
|
|---|
General Statistics
Number of major isoforms |
Number of additional isoforms |
Number of all proteins |
Number of amino acids |
Min. Seq. Length |
Max. Seq. Length |
Avg. Seq. Length |
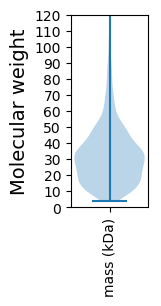
Avg. Mol. Weight |
|---|---|---|---|---|---|---|---|
0 |
1182256 |
39 |
2141 |
308.5 |
33.71 |
Amino acid frequency
Ala |
Cys |
Asp |
Glu |
Phe |
Gly |
His |
Ile |
Lys |
Leu |
|---|---|---|---|---|---|---|---|---|---|
11.244 ± 0.049 | 0.947 ± 0.014 |
6.012 ± 0.038 | 6.057 ± 0.036 |
3.891 ± 0.026 | 8.062 ± 0.041 |
2.161 ± 0.022 | 5.427 ± 0.026 |
3.753 ± 0.027 | 10.184 ± 0.049 |
Met |
Asn |
Gln |
Pro |
Arg |
Ser |
Thr |
Val |
Trp |
Tyr |
|---|---|---|---|---|---|---|---|---|---|
2.673 ± 0.019 | 3.037 ± 0.023 |
4.726 ± 0.025 | 3.812 ± 0.027 |
6.053 ± 0.037 | 5.693 ± 0.03 |
5.59 ± 0.027 | 7.048 ± 0.031 |
1.332 ± 0.017 | 2.298 ± 0.018 |
Most of the basic statistics you can see at this page can be downloaded from this CSV file
See this proteome in:

Proteome-pI is available under Creative Commons Attribution-NoDerivs license, for more details see here
| Reference: Kozlowski LP. Proteome-pI 2.0: Proteome Isoelectric Point Database Update. Nucleic Acids Res. 2021, doi: 10.1093/nar/gkab944 | Contact: Lukasz P. Kozlowski |