Pseudomonas kuykendallii
Taxonomy: cellular organisms; Bacteria; Proteobacteria; Gammaproteobacteria; Pseudomonadales; Pseudomonadaceae; Pseudomonas
Average proteome isoelectric point is 6.37
Get precalculated fractions of proteins
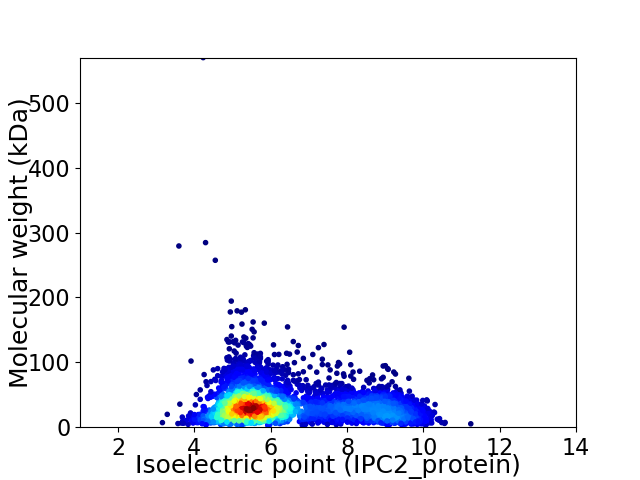
Virtual 2D-PAGE plot for 4331 proteins (isoelectric point calculated using IPC2_protein)
Get csv file with sequences according to given criteria:
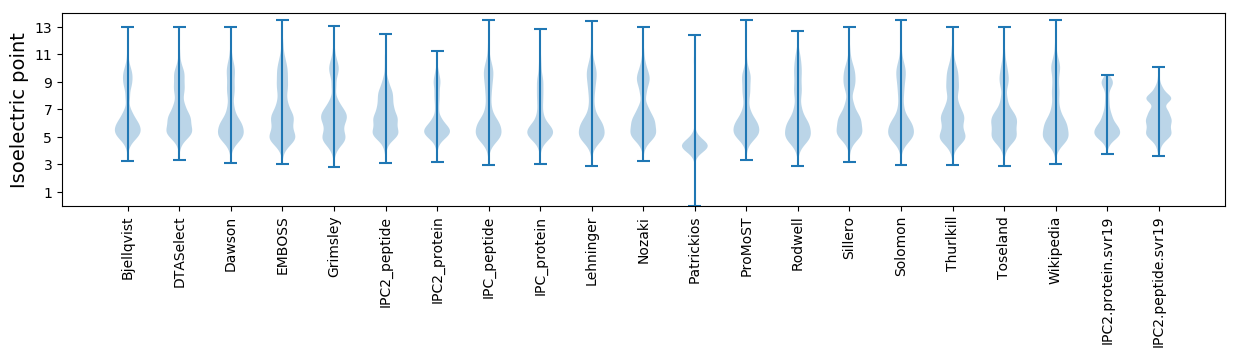
* You can choose from 21 different methods for calculating isoelectric point
Summary statistics related to proteome-wise predictions
Protein with the lowest isoelectric point:
>tr|A0A2W5ERA3|A0A2W5ERA3_9PSED Bifunctional protein FolD OS=Pseudomonas kuykendallii OX=1007099 GN=folD PE=3 SV=1
MM1 pKa = 7.56KK2 pKa = 10.16KK3 pKa = 8.28WQCVVCGLIYY13 pKa = 10.71DD14 pKa = 4.34EE15 pKa = 5.33AEE17 pKa = 3.76GWPDD21 pKa = 3.48DD22 pKa = 4.63GIAAGTLWQDD32 pKa = 3.46VPEE35 pKa = 5.1DD36 pKa = 4.13WLCPDD41 pKa = 4.25CGVGKK46 pKa = 10.46SDD48 pKa = 4.34FEE50 pKa = 4.49MIEE53 pKa = 3.92IAA55 pKa = 5.16
MM1 pKa = 7.56KK2 pKa = 10.16KK3 pKa = 8.28WQCVVCGLIYY13 pKa = 10.71DD14 pKa = 4.34EE15 pKa = 5.33AEE17 pKa = 3.76GWPDD21 pKa = 3.48DD22 pKa = 4.63GIAAGTLWQDD32 pKa = 3.46VPEE35 pKa = 5.1DD36 pKa = 4.13WLCPDD41 pKa = 4.25CGVGKK46 pKa = 10.46SDD48 pKa = 4.34FEE50 pKa = 4.49MIEE53 pKa = 3.92IAA55 pKa = 5.16
Molecular weight: 6.13 kDa
Isoelectric point according different methods:
Protein with the highest isoelectric point:
>tr|A0A2W5CX60|A0A2W5CX60_9PSED DUF484 domain-containing protein OS=Pseudomonas kuykendallii OX=1007099 GN=DI599_17810 PE=4 SV=1
MM1 pKa = 7.45KK2 pKa = 9.56RR3 pKa = 11.84TFQPSTIKK11 pKa = 10.34RR12 pKa = 11.84ARR14 pKa = 11.84VHH16 pKa = 6.23GFRR19 pKa = 11.84ARR21 pKa = 11.84MATKK25 pKa = 10.29NGRR28 pKa = 11.84QVLSRR33 pKa = 11.84RR34 pKa = 11.84RR35 pKa = 11.84AKK37 pKa = 9.83GRR39 pKa = 11.84KK40 pKa = 8.88RR41 pKa = 11.84LTVV44 pKa = 3.11
MM1 pKa = 7.45KK2 pKa = 9.56RR3 pKa = 11.84TFQPSTIKK11 pKa = 10.34RR12 pKa = 11.84ARR14 pKa = 11.84VHH16 pKa = 6.23GFRR19 pKa = 11.84ARR21 pKa = 11.84MATKK25 pKa = 10.29NGRR28 pKa = 11.84QVLSRR33 pKa = 11.84RR34 pKa = 11.84RR35 pKa = 11.84AKK37 pKa = 9.83GRR39 pKa = 11.84KK40 pKa = 8.88RR41 pKa = 11.84LTVV44 pKa = 3.11
Molecular weight: 5.21 kDa
Isoelectric point according different methods:
Peptides (in silico digests for buttom-up proteomics)
Below you can find in silico digests of the whole proteome with Trypsin, Chymotrypsin, Trypsin+LysC, LysN, ArgC proteases suitable for different mass spec machines.| Try ESI |
 |
|---|
| ChTry ESI |
|
|---|
| ArgC ESI |
|
|---|
| LysN ESI |
|
|---|
| TryLysC ESI |
|
|---|
| Try MALDI |
|
|---|
| ChTry MALDI |
|
|---|
| ArgC MALDI |
|
|---|
| LysN MALDI |
|
|---|
| TryLysC MALDI |
|
|---|
| Try LTQ |
|
|---|
| ChTry LTQ |
|
|---|
| ArgC LTQ |
|
|---|
| LysN LTQ |
|
|---|
| TryLysC LTQ |
|
|---|
| Try MSlow |
|
|---|
| ChTry MSlow |
|
|---|
| ArgC MSlow |
|
|---|
| LysN MSlow |
|
|---|
| TryLysC MSlow |
|
|---|
| Try MShigh |
|
|---|
| ChTry MShigh |
|
|---|
| ArgC MShigh |
|
|---|
| LysN MShigh |
|
|---|
| TryLysC MShigh |
|
|---|
General Statistics
Number of major isoforms |
Number of additional isoforms |
Number of all proteins |
Number of amino acids |
Min. Seq. Length |
Max. Seq. Length |
Avg. Seq. Length |
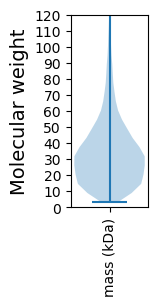
Avg. Mol. Weight |
|---|---|---|---|---|---|---|---|
0 |
1397955 |
29 |
5871 |
322.8 |
35.34 |
Amino acid frequency
Ala |
Cys |
Asp |
Glu |
Phe |
Gly |
His |
Ile |
Lys |
Leu |
|---|---|---|---|---|---|---|---|---|---|
11.629 ± 0.047 | 0.988 ± 0.01 |
5.441 ± 0.03 | 5.961 ± 0.04 |
3.625 ± 0.027 | 8.212 ± 0.051 |
2.19 ± 0.019 | 4.548 ± 0.027 |
3.104 ± 0.034 | 12.119 ± 0.065 |
Met |
Asn |
Gln |
Pro |
Arg |
Ser |
Thr |
Val |
Trp |
Tyr |
|---|---|---|---|---|---|---|---|---|---|
2.221 ± 0.018 | 2.747 ± 0.027 |
4.912 ± 0.031 | 4.272 ± 0.026 |
7.067 ± 0.043 | 5.644 ± 0.035 |
4.489 ± 0.034 | 6.975 ± 0.03 |
1.403 ± 0.017 | 2.455 ± 0.022 |
Most of the basic statistics you can see at this page can be downloaded from this CSV file
See this proteome in:

Proteome-pI is available under Creative Commons Attribution-NoDerivs license, for more details see here
| Reference: Kozlowski LP. Proteome-pI 2.0: Proteome Isoelectric Point Database Update. Nucleic Acids Res. 2021, doi: 10.1093/nar/gkab944 | Contact: Lukasz P. Kozlowski |