Microbacterium phage Leaf
Taxonomy: Viruses; Duplodnaviria; Heunggongvirae; Uroviricota; Caudoviricetes; Caudovirales; Siphoviridae; Rogerhendrixvirus; unclassified Rogerhendrixvirus
Average proteome isoelectric point is 5.83
Get precalculated fractions of proteins
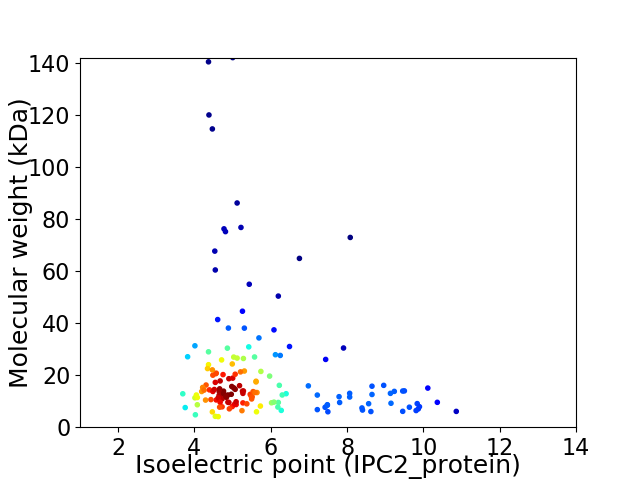
Virtual 2D-PAGE plot for 156 proteins (isoelectric point calculated using IPC2_protein)
Get csv file with sequences according to given criteria:
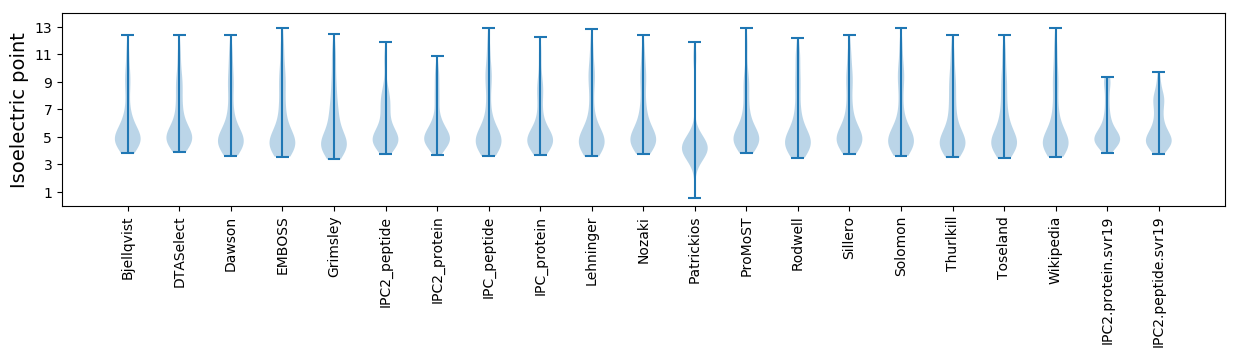
* You can choose from 21 different methods for calculating isoelectric point
Summary statistics related to proteome-wise predictions
Protein with the lowest isoelectric point:
>tr|A0A6B9JDG2|A0A6B9JDG2_9CAUD Uncharacterized protein OS=Microbacterium phage Leaf OX=2686087 GN=75 PE=4 SV=1
MM1 pKa = 8.03PINDD5 pKa = 4.11ALLNAGATAMGTAAAYY21 pKa = 10.26ASIHH25 pKa = 5.04TAQPNAAGNNEE36 pKa = 3.98STAARR41 pKa = 11.84QLIDD45 pKa = 3.33WSTASAGDD53 pKa = 3.82LALDD57 pKa = 3.99APLAFTGGAAGGPATHH73 pKa = 7.06LGLWSAPTAGTFYY86 pKa = 10.85GYY88 pKa = 10.76FPLTGDD94 pKa = 3.45QAFNAAGEE102 pKa = 4.34FTVTALALTGSATGAA117 pKa = 3.43
MM1 pKa = 8.03PINDD5 pKa = 4.11ALLNAGATAMGTAAAYY21 pKa = 10.26ASIHH25 pKa = 5.04TAQPNAAGNNEE36 pKa = 3.98STAARR41 pKa = 11.84QLIDD45 pKa = 3.33WSTASAGDD53 pKa = 3.82LALDD57 pKa = 3.99APLAFTGGAAGGPATHH73 pKa = 7.06LGLWSAPTAGTFYY86 pKa = 10.85GYY88 pKa = 10.76FPLTGDD94 pKa = 3.45QAFNAAGEE102 pKa = 4.34FTVTALALTGSATGAA117 pKa = 3.43
Molecular weight: 11.4 kDa
Isoelectric point according different methods:
Protein with the highest isoelectric point:
>tr|A0A6B9JAS0|A0A6B9JAS0_9CAUD Tape measure protein OS=Microbacterium phage Leaf OX=2686087 GN=76 PE=4 SV=1
MM1 pKa = 7.8GIFGINWSRR10 pKa = 11.84QIRR13 pKa = 11.84RR14 pKa = 11.84ATTKK18 pKa = 10.05AVKK21 pKa = 10.38GGTRR25 pKa = 11.84WASKK29 pKa = 9.93PYY31 pKa = 10.24RR32 pKa = 11.84EE33 pKa = 4.18QKK35 pKa = 10.47RR36 pKa = 11.84NNKK39 pKa = 8.79AAARR43 pKa = 11.84RR44 pKa = 11.84RR45 pKa = 11.84KK46 pKa = 6.76TWRR49 pKa = 11.84ARR51 pKa = 3.27
MM1 pKa = 7.8GIFGINWSRR10 pKa = 11.84QIRR13 pKa = 11.84RR14 pKa = 11.84ATTKK18 pKa = 10.05AVKK21 pKa = 10.38GGTRR25 pKa = 11.84WASKK29 pKa = 9.93PYY31 pKa = 10.24RR32 pKa = 11.84EE33 pKa = 4.18QKK35 pKa = 10.47RR36 pKa = 11.84NNKK39 pKa = 8.79AAARR43 pKa = 11.84RR44 pKa = 11.84RR45 pKa = 11.84KK46 pKa = 6.76TWRR49 pKa = 11.84ARR51 pKa = 3.27
Molecular weight: 6.07 kDa
Isoelectric point according different methods:
Peptides (in silico digests for buttom-up proteomics)
Below you can find in silico digests of the whole proteome with Trypsin, Chymotrypsin, Trypsin+LysC, LysN, ArgC proteases suitable for different mass spec machines.| Try ESI |
 |
|---|
| ChTry ESI |
|
|---|
| ArgC ESI |
|
|---|
| LysN ESI |
|
|---|
| TryLysC ESI |
|
|---|
| Try MALDI |
|
|---|
| ChTry MALDI |
|
|---|
| ArgC MALDI |
|
|---|
| LysN MALDI |
|
|---|
| TryLysC MALDI |
|
|---|
| Try LTQ |
|
|---|
| ChTry LTQ |
|
|---|
| ArgC LTQ |
|
|---|
| LysN LTQ |
|
|---|
| TryLysC LTQ |
|
|---|
| Try MSlow |
|
|---|
| ChTry MSlow |
|
|---|
| ArgC MSlow |
|
|---|
| LysN MSlow |
|
|---|
| TryLysC MSlow |
|
|---|
| Try MShigh |
|
|---|
| ChTry MShigh |
|
|---|
| ArgC MShigh |
|
|---|
| LysN MShigh |
|
|---|
| TryLysC MShigh |
|
|---|
General Statistics
Number of major isoforms |
Number of additional isoforms |
Number of all proteins |
Number of amino acids |
Min. Seq. Length |
Max. Seq. Length |
Avg. Seq. Length |
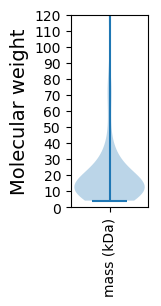
Avg. Mol. Weight |
|---|---|---|---|---|---|---|---|
0 |
30325 |
40 |
1332 |
194.4 |
21.46 |
Amino acid frequency
Ala |
Cys |
Asp |
Glu |
Phe |
Gly |
His |
Ile |
Lys |
Leu |
|---|---|---|---|---|---|---|---|---|---|
10.417 ± 0.339 | 0.805 ± 0.092 |
6.315 ± 0.232 | 7.73 ± 0.384 |
2.961 ± 0.133 | 8.185 ± 0.302 |
1.926 ± 0.126 | 4.452 ± 0.181 |
3.631 ± 0.207 | 7.832 ± 0.216 |
Met |
Asn |
Gln |
Pro |
Arg |
Ser |
Thr |
Val |
Trp |
Tyr |
|---|---|---|---|---|---|---|---|---|---|
2.612 ± 0.109 | 2.988 ± 0.149 |
5.56 ± 0.246 | 3.766 ± 0.133 |
6.76 ± 0.286 | 5.454 ± 0.231 |
6.473 ± 0.271 | 7.268 ± 0.205 |
2.325 ± 0.137 | 2.542 ± 0.142 |
Most of the basic statistics you can see at this page can be downloaded from this CSV file
See this proteome in:

Proteome-pI is available under Creative Commons Attribution-NoDerivs license, for more details see here
| Reference: Kozlowski LP. Proteome-pI 2.0: Proteome Isoelectric Point Database Update. Nucleic Acids Res. 2021, doi: 10.1093/nar/gkab944 | Contact: Lukasz P. Kozlowski |