Rhizobium phage B1VFA
Taxonomy: Viruses; Duplodnaviria; Heunggongvirae; Uroviricota; Caudoviricetes; Caudovirales; Siphoviridae; unclassified Siphoviridae
Average proteome isoelectric point is 6.27
Get precalculated fractions of proteins
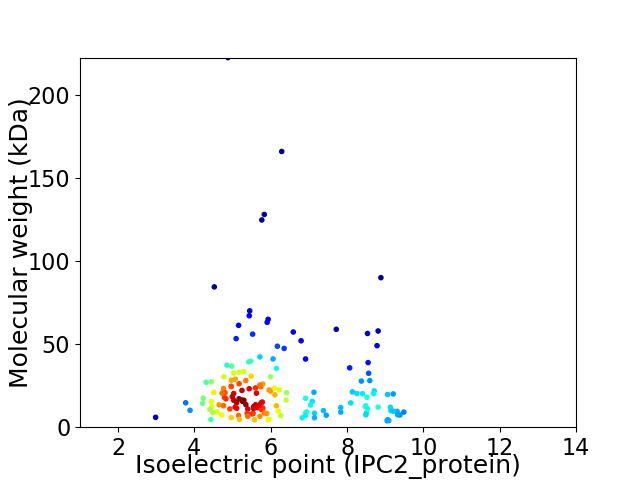
Virtual 2D-PAGE plot for 160 proteins (isoelectric point calculated using IPC2_protein)
Get csv file with sequences according to given criteria:
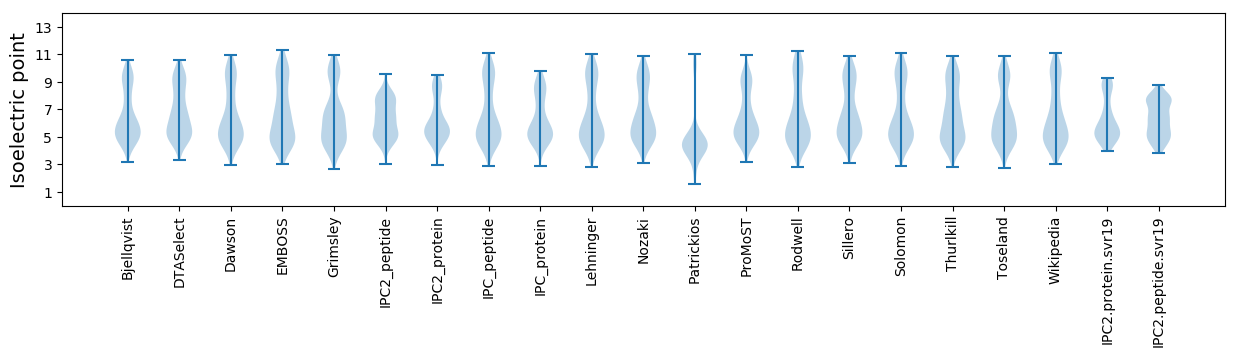
* You can choose from 21 different methods for calculating isoelectric point
Summary statistics related to proteome-wise predictions
Protein with the lowest isoelectric point:
>tr|A0A7G7NBW3|A0A7G7NBW3_9CAUD Uncharacterized protein OS=Rhizobium phage B1VFA OX=2759201 GN=B1VFA_050 PE=4 SV=1
MM1 pKa = 7.79SDD3 pKa = 3.5FLEE6 pKa = 4.31FMIILTSFCIVGMALVFAYY25 pKa = 9.59KK26 pKa = 10.52AIDD29 pKa = 3.48NYY31 pKa = 11.04GSNRR35 pKa = 11.84DD36 pKa = 2.84WWII39 pKa = 3.25
MM1 pKa = 7.79SDD3 pKa = 3.5FLEE6 pKa = 4.31FMIILTSFCIVGMALVFAYY25 pKa = 9.59KK26 pKa = 10.52AIDD29 pKa = 3.48NYY31 pKa = 11.04GSNRR35 pKa = 11.84DD36 pKa = 2.84WWII39 pKa = 3.25
Molecular weight: 4.58 kDa
Isoelectric point according different methods:
Protein with the highest isoelectric point:
>tr|A0A7G7NBT3|A0A7G7NBT3_9CAUD Uncharacterized protein OS=Rhizobium phage B1VFA OX=2759201 GN=B1VFA_027 PE=4 SV=1
MM1 pKa = 7.37SVQKK5 pKa = 10.38RR6 pKa = 11.84KK7 pKa = 10.17RR8 pKa = 11.84EE9 pKa = 3.95LLQLARR15 pKa = 11.84AICPKK20 pKa = 9.96ATIEE24 pKa = 4.26HH25 pKa = 6.63SGHH28 pKa = 6.51HH29 pKa = 5.33LQITIFGPNGSRR41 pKa = 11.84KK42 pKa = 9.28VFCASTAGDD51 pKa = 3.49HH52 pKa = 7.49RR53 pKa = 11.84DD54 pKa = 3.45TKK56 pKa = 10.57NVKK59 pKa = 9.82RR60 pKa = 11.84DD61 pKa = 3.37LLAAARR67 pKa = 11.84AIGLIANQNEE77 pKa = 4.24PPASQRR83 pKa = 3.35
MM1 pKa = 7.37SVQKK5 pKa = 10.38RR6 pKa = 11.84KK7 pKa = 10.17RR8 pKa = 11.84EE9 pKa = 3.95LLQLARR15 pKa = 11.84AICPKK20 pKa = 9.96ATIEE24 pKa = 4.26HH25 pKa = 6.63SGHH28 pKa = 6.51HH29 pKa = 5.33LQITIFGPNGSRR41 pKa = 11.84KK42 pKa = 9.28VFCASTAGDD51 pKa = 3.49HH52 pKa = 7.49RR53 pKa = 11.84DD54 pKa = 3.45TKK56 pKa = 10.57NVKK59 pKa = 9.82RR60 pKa = 11.84DD61 pKa = 3.37LLAAARR67 pKa = 11.84AIGLIANQNEE77 pKa = 4.24PPASQRR83 pKa = 3.35
Molecular weight: 9.11 kDa
Isoelectric point according different methods:
Peptides (in silico digests for buttom-up proteomics)
Below you can find in silico digests of the whole proteome with Trypsin, Chymotrypsin, Trypsin+LysC, LysN, ArgC proteases suitable for different mass spec machines.| Try ESI |
 |
|---|
| ChTry ESI |
|
|---|
| ArgC ESI |
|
|---|
| LysN ESI |
|
|---|
| TryLysC ESI |
|
|---|
| Try MALDI |
|
|---|
| ChTry MALDI |
|
|---|
| ArgC MALDI |
|
|---|
| LysN MALDI |
|
|---|
| TryLysC MALDI |
|
|---|
| Try LTQ |
|
|---|
| ChTry LTQ |
|
|---|
| ArgC LTQ |
|
|---|
| LysN LTQ |
|
|---|
| TryLysC LTQ |
|
|---|
| Try MSlow |
|
|---|
| ChTry MSlow |
|
|---|
| ArgC MSlow |
|
|---|
| LysN MSlow |
|
|---|
| TryLysC MSlow |
|
|---|
| Try MShigh |
|
|---|
| ChTry MShigh |
|
|---|
| ArgC MShigh |
|
|---|
| LysN MShigh |
|
|---|
| TryLysC MShigh |
|
|---|
General Statistics
Number of major isoforms |
Number of additional isoforms |
Number of all proteins |
Number of amino acids |
Min. Seq. Length |
Max. Seq. Length |
Avg. Seq. Length |
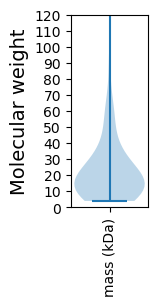
Avg. Mol. Weight |
|---|---|---|---|---|---|---|---|
0 |
36726 |
34 |
2064 |
229.5 |
25.38 |
Amino acid frequency
Ala |
Cys |
Asp |
Glu |
Phe |
Gly |
His |
Ile |
Lys |
Leu |
|---|---|---|---|---|---|---|---|---|---|
10.761 ± 0.272 | 0.795 ± 0.064 |
6.431 ± 0.155 | 6.845 ± 0.28 |
3.847 ± 0.124 | 7.382 ± 0.247 |
1.89 ± 0.097 | 5.74 ± 0.096 |
5.982 ± 0.248 | 8.109 ± 0.168 |
Met |
Asn |
Gln |
Pro |
Arg |
Ser |
Thr |
Val |
Trp |
Tyr |
|---|---|---|---|---|---|---|---|---|---|
2.679 ± 0.134 | 3.817 ± 0.162 |
4.22 ± 0.146 | 3.542 ± 0.15 |
5.821 ± 0.163 | 5.296 ± 0.176 |
6.031 ± 0.348 | 6.676 ± 0.182 |
1.315 ± 0.083 | 2.818 ± 0.122 |
Most of the basic statistics you can see at this page can be downloaded from this CSV file
See this proteome in:

Proteome-pI is available under Creative Commons Attribution-NoDerivs license, for more details see here
| Reference: Kozlowski LP. Proteome-pI 2.0: Proteome Isoelectric Point Database Update. Nucleic Acids Res. 2021, doi: 10.1093/nar/gkab944 | Contact: Lukasz P. Kozlowski |