Arthronema virus TR020
Taxonomy: Viruses; Duplodnaviria; Heunggongvirae; Uroviricota; Caudoviricetes; Caudovirales; Podoviridae; unclassified Podoviridae
Average proteome isoelectric point is 5.96
Get precalculated fractions of proteins
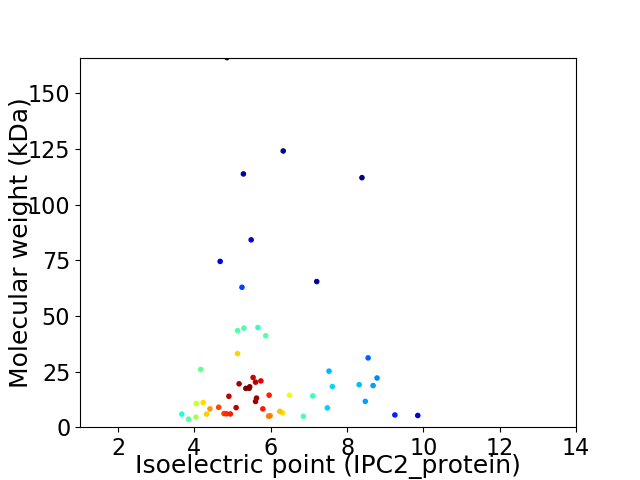
Virtual 2D-PAGE plot for 55 proteins (isoelectric point calculated using IPC2_protein)
Get csv file with sequences according to given criteria:
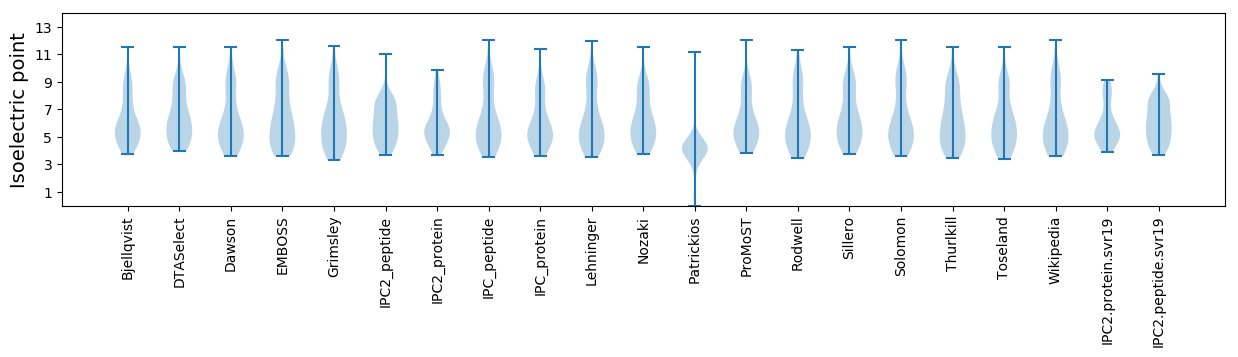
* You can choose from 21 different methods for calculating isoelectric point
Summary statistics related to proteome-wise predictions
Protein with the lowest isoelectric point:
>tr|A0A7G5AWZ8|A0A7G5AWZ8_9CAUD Putative endopeptidase OS=Arthronema virus TR020 OX=2736280 PE=4 SV=1
MM1 pKa = 7.37PNSVRR6 pKa = 11.84VLWDD10 pKa = 3.58DD11 pKa = 4.6DD12 pKa = 3.45FTGYY16 pKa = 7.57VTCDD20 pKa = 3.42LQDD23 pKa = 3.38GTLHH27 pKa = 6.01YY28 pKa = 11.31GEE30 pKa = 5.02VPLEE34 pKa = 3.63LMTYY38 pKa = 9.56HH39 pKa = 6.19NQPIEE44 pKa = 4.95DD45 pKa = 4.34IYY47 pKa = 11.62DD48 pKa = 3.83DD49 pKa = 4.04YY50 pKa = 12.25
MM1 pKa = 7.37PNSVRR6 pKa = 11.84VLWDD10 pKa = 3.58DD11 pKa = 4.6DD12 pKa = 3.45FTGYY16 pKa = 7.57VTCDD20 pKa = 3.42LQDD23 pKa = 3.38GTLHH27 pKa = 6.01YY28 pKa = 11.31GEE30 pKa = 5.02VPLEE34 pKa = 3.63LMTYY38 pKa = 9.56HH39 pKa = 6.19NQPIEE44 pKa = 4.95DD45 pKa = 4.34IYY47 pKa = 11.62DD48 pKa = 3.83DD49 pKa = 4.04YY50 pKa = 12.25
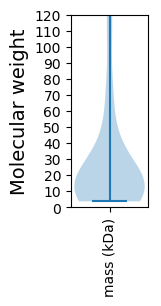
Molecular weight: 5.9 kDa
Isoelectric point according different methods:
Protein with the highest isoelectric point:
>tr|A0A7G3WH16|A0A7G3WH16_9CAUD Uncharacterized protein OS=Arthronema virus TR020 OX=2736280 PE=4 SV=1
MM1 pKa = 6.73NTRR4 pKa = 11.84VLLTFLVFLMFSAHH18 pKa = 6.38AALALRR24 pKa = 11.84HH25 pKa = 5.67MLGSHH30 pKa = 6.31LQRR33 pKa = 11.84LNTIEE38 pKa = 3.8QSEE41 pKa = 4.49RR42 pKa = 11.84KK43 pKa = 8.68HH44 pKa = 4.91QQ45 pKa = 3.63
MM1 pKa = 6.73NTRR4 pKa = 11.84VLLTFLVFLMFSAHH18 pKa = 6.38AALALRR24 pKa = 11.84HH25 pKa = 5.67MLGSHH30 pKa = 6.31LQRR33 pKa = 11.84LNTIEE38 pKa = 3.8QSEE41 pKa = 4.49RR42 pKa = 11.84KK43 pKa = 8.68HH44 pKa = 4.91QQ45 pKa = 3.63
Molecular weight: 5.26 kDa
Isoelectric point according different methods:
Peptides (in silico digests for buttom-up proteomics)
Below you can find in silico digests of the whole proteome with Trypsin, Chymotrypsin, Trypsin+LysC, LysN, ArgC proteases suitable for different mass spec machines.| Try ESI |
 |
|---|
| ChTry ESI |
|
|---|
| ArgC ESI |
|
|---|
| LysN ESI |
|
|---|
| TryLysC ESI |
|
|---|
| Try MALDI |
|
|---|
| ChTry MALDI |
|
|---|
| ArgC MALDI |
|
|---|
| LysN MALDI |
|
|---|
| TryLysC MALDI |
|
|---|
| Try LTQ |
|
|---|
| ChTry LTQ |
|
|---|
| ArgC LTQ |
|
|---|
| LysN LTQ |
|
|---|
| TryLysC LTQ |
|
|---|
| Try MSlow |
|
|---|
| ChTry MSlow |
|
|---|
| ArgC MSlow |
|
|---|
| LysN MSlow |
|
|---|
| TryLysC MSlow |
|
|---|
| Try MShigh |
|
|---|
| ChTry MShigh |
|
|---|
| ArgC MShigh |
|
|---|
| LysN MShigh |
|
|---|
| TryLysC MShigh |
|
|---|
General Statistics
Number of major isoforms |
Number of additional isoforms |
Number of all proteins |
Number of amino acids |
Min. Seq. Length |
Max. Seq. Length |
Avg. Seq. Length |
Avg. Mol. Weight |
|---|---|---|---|---|---|---|---|
0 |
13728 |
31 |
1506 |
249.6 |
28.01 |
Amino acid frequency
Ala |
Cys |
Asp |
Glu |
Phe |
Gly |
His |
Ile |
Lys |
Leu |
|---|---|---|---|---|---|---|---|---|---|
7.561 ± 0.374 | 0.386 ± 0.095 |
6.119 ± 0.259 | 6.52 ± 0.399 |
3.795 ± 0.246 | 6.439 ± 0.243 |
1.632 ± 0.199 | 4.939 ± 0.245 |
4.924 ± 0.273 | 9.521 ± 0.297 |
Met |
Asn |
Gln |
Pro |
Arg |
Ser |
Thr |
Val |
Trp |
Tyr |
|---|---|---|---|---|---|---|---|---|---|
2.426 ± 0.221 | 5.507 ± 0.259 |
4.159 ± 0.392 | 4.538 ± 0.378 |
5.704 ± 0.259 | 6.6 ± 0.376 |
6.993 ± 0.431 | 7.059 ± 0.327 |
1.151 ± 0.124 | 4.028 ± 0.293 |
Most of the basic statistics you can see at this page can be downloaded from this CSV file
See this proteome in:

Proteome-pI is available under Creative Commons Attribution-NoDerivs license, for more details see here
| Reference: Kozlowski LP. Proteome-pI 2.0: Proteome Isoelectric Point Database Update. Nucleic Acids Res. 2021, doi: 10.1093/nar/gkab944 | Contact: Lukasz P. Kozlowski |