Dyella tabacisoli
Taxonomy: cellular organisms; Bacteria; Proteobacteria; Gammaproteobacteria; Xanthomonadales; Rhodanobacteraceae; Dyella
Average proteome isoelectric point is 6.66
Get precalculated fractions of proteins
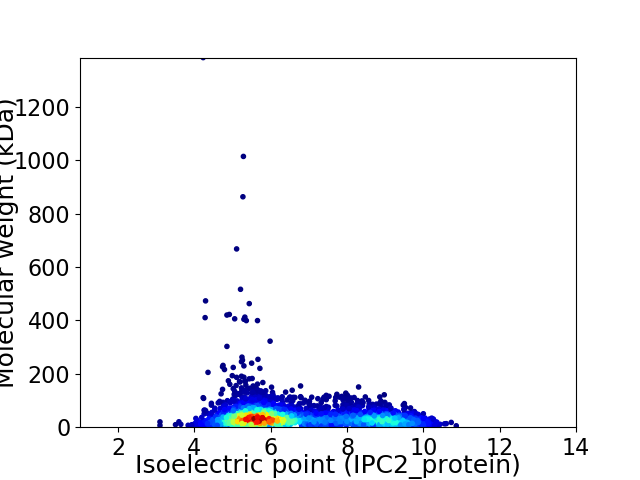
Virtual 2D-PAGE plot for 4066 proteins (isoelectric point calculated using IPC2_protein)
Get csv file with sequences according to given criteria:
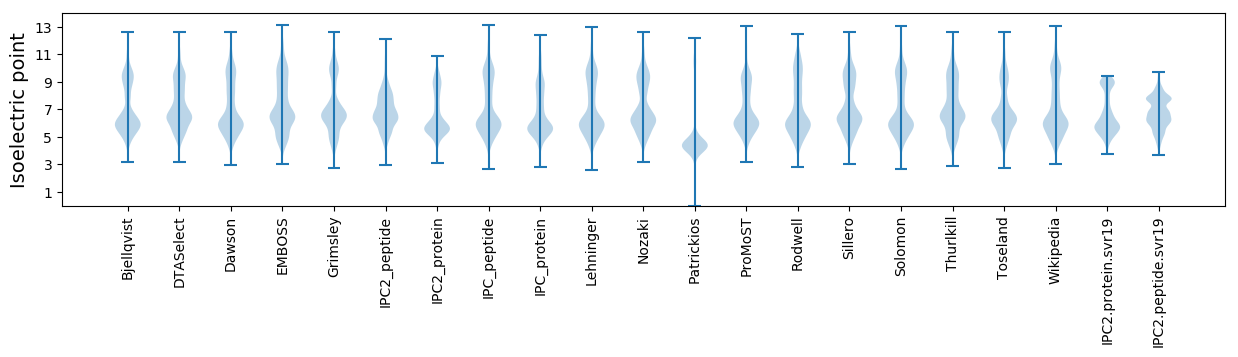
* You can choose from 21 different methods for calculating isoelectric point
Summary statistics related to proteome-wise predictions
Protein with the lowest isoelectric point:
>tr|A0A369UKQ3|A0A369UKQ3_9GAMM MoxR family ATPase OS=Dyella tabacisoli OX=2282381 GN=DVJ77_12515 PE=4 SV=1
MM1 pKa = 7.07SQSSTEE7 pKa = 4.05TKK9 pKa = 10.62ALSKK13 pKa = 9.67WMCVVCGFIYY23 pKa = 10.65DD24 pKa = 3.97EE25 pKa = 5.19AEE27 pKa = 4.0GLPDD31 pKa = 3.62EE32 pKa = 5.37GIEE35 pKa = 4.8PGTRR39 pKa = 11.84WADD42 pKa = 3.34VPAAWTCPDD51 pKa = 3.81CGATKK56 pKa = 10.7DD57 pKa = 3.88DD58 pKa = 4.33FEE60 pKa = 5.12MIEE63 pKa = 3.83IDD65 pKa = 3.43
MM1 pKa = 7.07SQSSTEE7 pKa = 4.05TKK9 pKa = 10.62ALSKK13 pKa = 9.67WMCVVCGFIYY23 pKa = 10.65DD24 pKa = 3.97EE25 pKa = 5.19AEE27 pKa = 4.0GLPDD31 pKa = 3.62EE32 pKa = 5.37GIEE35 pKa = 4.8PGTRR39 pKa = 11.84WADD42 pKa = 3.34VPAAWTCPDD51 pKa = 3.81CGATKK56 pKa = 10.7DD57 pKa = 3.88DD58 pKa = 4.33FEE60 pKa = 5.12MIEE63 pKa = 3.83IDD65 pKa = 3.43
Molecular weight: 7.15 kDa
Isoelectric point according different methods:
Protein with the highest isoelectric point:
>tr|A0A369ULK8|A0A369ULK8_9GAMM MFS transporter OS=Dyella tabacisoli OX=2282381 GN=DVJ77_10760 PE=4 SV=1
MM1 pKa = 7.69SKK3 pKa = 9.01RR4 pKa = 11.84TFQPSKK10 pKa = 10.06LKK12 pKa = 10.38RR13 pKa = 11.84ARR15 pKa = 11.84THH17 pKa = 5.89GFRR20 pKa = 11.84ARR22 pKa = 11.84MATADD27 pKa = 3.2GRR29 pKa = 11.84KK30 pKa = 9.07ILNARR35 pKa = 11.84RR36 pKa = 11.84AKK38 pKa = 9.77GRR40 pKa = 11.84KK41 pKa = 8.92RR42 pKa = 11.84LIPP45 pKa = 4.02
MM1 pKa = 7.69SKK3 pKa = 9.01RR4 pKa = 11.84TFQPSKK10 pKa = 10.06LKK12 pKa = 10.38RR13 pKa = 11.84ARR15 pKa = 11.84THH17 pKa = 5.89GFRR20 pKa = 11.84ARR22 pKa = 11.84MATADD27 pKa = 3.2GRR29 pKa = 11.84KK30 pKa = 9.07ILNARR35 pKa = 11.84RR36 pKa = 11.84AKK38 pKa = 9.77GRR40 pKa = 11.84KK41 pKa = 8.92RR42 pKa = 11.84LIPP45 pKa = 4.02
Molecular weight: 5.24 kDa
Isoelectric point according different methods:
Peptides (in silico digests for buttom-up proteomics)
Below you can find in silico digests of the whole proteome with Trypsin, Chymotrypsin, Trypsin+LysC, LysN, ArgC proteases suitable for different mass spec machines.| Try ESI |
 |
|---|
| ChTry ESI |
|
|---|
| ArgC ESI |
|
|---|
| LysN ESI |
|
|---|
| TryLysC ESI |
|
|---|
| Try MALDI |
|
|---|
| ChTry MALDI |
|
|---|
| ArgC MALDI |
|
|---|
| LysN MALDI |
|
|---|
| TryLysC MALDI |
|
|---|
| Try LTQ |
|
|---|
| ChTry LTQ |
|
|---|
| ArgC LTQ |
|
|---|
| LysN LTQ |
|
|---|
| TryLysC LTQ |
|
|---|
| Try MSlow |
|
|---|
| ChTry MSlow |
|
|---|
| ArgC MSlow |
|
|---|
| LysN MSlow |
|
|---|
| TryLysC MSlow |
|
|---|
| Try MShigh |
|
|---|
| ChTry MShigh |
|
|---|
| ArgC MShigh |
|
|---|
| LysN MShigh |
|
|---|
| TryLysC MShigh |
|
|---|
General Statistics
Number of major isoforms |
Number of additional isoforms |
Number of all proteins |
Number of amino acids |
Min. Seq. Length |
Max. Seq. Length |
Avg. Seq. Length |
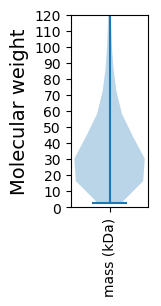
Avg. Mol. Weight |
|---|---|---|---|---|---|---|---|
0 |
1484847 |
22 |
13240 |
365.2 |
39.72 |
Amino acid frequency
Ala |
Cys |
Asp |
Glu |
Phe |
Gly |
His |
Ile |
Lys |
Leu |
|---|---|---|---|---|---|---|---|---|---|
12.013 ± 0.054 | 0.83 ± 0.012 |
5.622 ± 0.028 | 4.82 ± 0.054 |
3.407 ± 0.026 | 8.268 ± 0.058 |
2.467 ± 0.021 | 4.534 ± 0.024 |
2.992 ± 0.04 | 10.859 ± 0.069 |
Met |
Asn |
Gln |
Pro |
Arg |
Ser |
Thr |
Val |
Trp |
Tyr |
|---|---|---|---|---|---|---|---|---|---|
2.182 ± 0.021 | 3.078 ± 0.05 |
5.214 ± 0.032 | 4.157 ± 0.029 |
6.635 ± 0.056 | 6.034 ± 0.046 |
5.502 ± 0.063 | 7.185 ± 0.036 |
1.51 ± 0.021 | 2.69 ± 0.028 |
Most of the basic statistics you can see at this page can be downloaded from this CSV file
See this proteome in:

Proteome-pI is available under Creative Commons Attribution-NoDerivs license, for more details see here
| Reference: Kozlowski LP. Proteome-pI 2.0: Proteome Isoelectric Point Database Update. Nucleic Acids Res. 2021, doi: 10.1093/nar/gkab944 | Contact: Lukasz P. Kozlowski |