Simian adenovirus 3
Taxonomy: Viruses; Varidnaviria; Bamfordvirae; Preplasmiviricota; Tectiliviricetes; Rowavirales; Adenoviridae; Mastadenovirus; Simian mastadenovirus A
Average proteome isoelectric point is 6.59
Get precalculated fractions of proteins
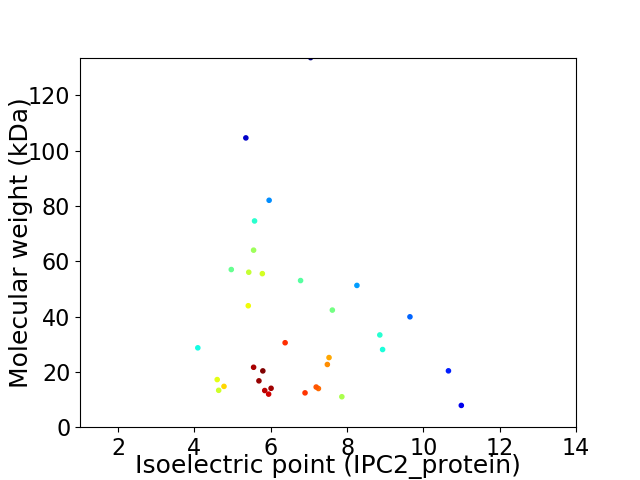
Virtual 2D-PAGE plot for 34 proteins (isoelectric point calculated using IPC2_protein)
Get csv file with sequences according to given criteria:
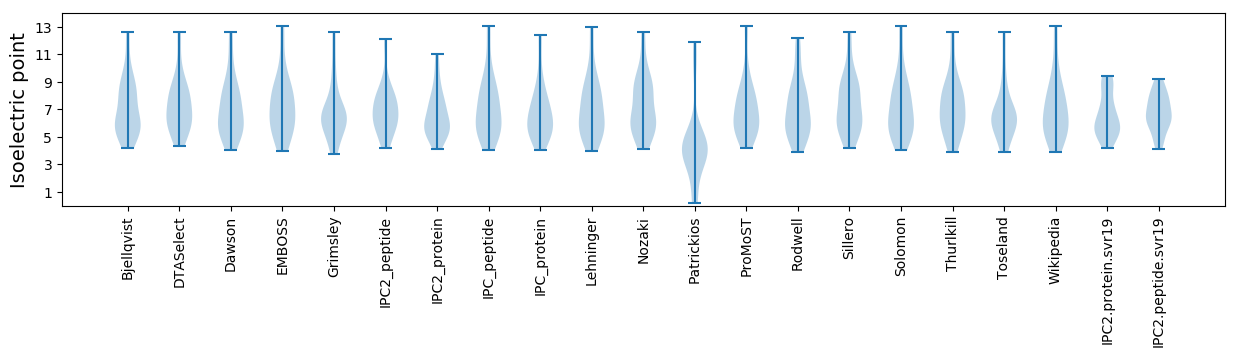
* You can choose from 21 different methods for calculating isoelectric point
Summary statistics related to proteome-wise predictions
Protein with the lowest isoelectric point:
>tr|Q695Q3|Q695Q3_9ADEN Isoform of Q695Q7 E4 ORF1 OS=Simian adenovirus 3 OX=38420 GN=E4 PE=4 SV=1
MM1 pKa = 7.87RR2 pKa = 11.84NFLLSPGLPATVAAEE17 pKa = 3.97LLEE20 pKa = 5.42DD21 pKa = 3.79IVTGALGDD29 pKa = 3.78EE30 pKa = 4.42PQVISHH36 pKa = 6.57FCEE39 pKa = 4.58DD40 pKa = 4.2FSLHH44 pKa = 6.83DD45 pKa = 5.55LYY47 pKa = 11.28DD48 pKa = 4.02IDD50 pKa = 5.51PGVEE54 pKa = 4.09GQADD58 pKa = 3.67EE59 pKa = 4.34WLEE62 pKa = 4.07SVDD65 pKa = 5.06GFFPDD70 pKa = 4.93AMLLEE75 pKa = 5.06ADD77 pKa = 5.18LPPSHH82 pKa = 6.94NSNTEE87 pKa = 3.9PEE89 pKa = 4.37SAAIPQLSSGEE100 pKa = 4.2LDD102 pKa = 3.56LACYY106 pKa = 7.85EE107 pKa = 4.29TMPPEE112 pKa = 4.3SDD114 pKa = 4.0EE115 pKa = 4.2EE116 pKa = 4.34DD117 pKa = 3.49SGISNPTDD125 pKa = 3.38YY126 pKa = 10.37MVSKK130 pKa = 10.84AIAILKK136 pKa = 10.16EE137 pKa = 4.3DD138 pKa = 5.31DD139 pKa = 4.82DD140 pKa = 6.93DD141 pKa = 7.13GDD143 pKa = 4.14DD144 pKa = 4.83GFRR147 pKa = 11.84LDD149 pKa = 4.08APAVPGRR156 pKa = 11.84DD157 pKa = 3.41CKK159 pKa = 10.14SCEE162 pKa = 3.74YY163 pKa = 10.35HH164 pKa = 7.11RR165 pKa = 11.84EE166 pKa = 4.08RR167 pKa = 11.84TGDD170 pKa = 3.4PCMLCSLCYY179 pKa = 10.36LRR181 pKa = 11.84LNAAFVYY188 pKa = 10.67SPVSDD193 pKa = 3.8VEE195 pKa = 4.59EE196 pKa = 4.72PDD198 pKa = 3.39STTGNEE204 pKa = 4.11EE205 pKa = 4.27EE206 pKa = 5.01KK207 pKa = 10.6PSPPKK212 pKa = 9.52LTQRR216 pKa = 11.84CRR218 pKa = 11.84PNILRR223 pKa = 11.84PSAQRR228 pKa = 11.84VSSRR232 pKa = 11.84KK233 pKa = 8.93RR234 pKa = 11.84AAVNCIEE241 pKa = 5.07DD242 pKa = 4.13LLEE245 pKa = 4.59EE246 pKa = 4.21PTEE249 pKa = 4.11PLDD252 pKa = 4.98LSLKK256 pKa = 10.28RR257 pKa = 11.84PRR259 pKa = 11.84PQQ261 pKa = 3.17
MM1 pKa = 7.87RR2 pKa = 11.84NFLLSPGLPATVAAEE17 pKa = 3.97LLEE20 pKa = 5.42DD21 pKa = 3.79IVTGALGDD29 pKa = 3.78EE30 pKa = 4.42PQVISHH36 pKa = 6.57FCEE39 pKa = 4.58DD40 pKa = 4.2FSLHH44 pKa = 6.83DD45 pKa = 5.55LYY47 pKa = 11.28DD48 pKa = 4.02IDD50 pKa = 5.51PGVEE54 pKa = 4.09GQADD58 pKa = 3.67EE59 pKa = 4.34WLEE62 pKa = 4.07SVDD65 pKa = 5.06GFFPDD70 pKa = 4.93AMLLEE75 pKa = 5.06ADD77 pKa = 5.18LPPSHH82 pKa = 6.94NSNTEE87 pKa = 3.9PEE89 pKa = 4.37SAAIPQLSSGEE100 pKa = 4.2LDD102 pKa = 3.56LACYY106 pKa = 7.85EE107 pKa = 4.29TMPPEE112 pKa = 4.3SDD114 pKa = 4.0EE115 pKa = 4.2EE116 pKa = 4.34DD117 pKa = 3.49SGISNPTDD125 pKa = 3.38YY126 pKa = 10.37MVSKK130 pKa = 10.84AIAILKK136 pKa = 10.16EE137 pKa = 4.3DD138 pKa = 5.31DD139 pKa = 4.82DD140 pKa = 6.93DD141 pKa = 7.13GDD143 pKa = 4.14DD144 pKa = 4.83GFRR147 pKa = 11.84LDD149 pKa = 4.08APAVPGRR156 pKa = 11.84DD157 pKa = 3.41CKK159 pKa = 10.14SCEE162 pKa = 3.74YY163 pKa = 10.35HH164 pKa = 7.11RR165 pKa = 11.84EE166 pKa = 4.08RR167 pKa = 11.84TGDD170 pKa = 3.4PCMLCSLCYY179 pKa = 10.36LRR181 pKa = 11.84LNAAFVYY188 pKa = 10.67SPVSDD193 pKa = 3.8VEE195 pKa = 4.59EE196 pKa = 4.72PDD198 pKa = 3.39STTGNEE204 pKa = 4.11EE205 pKa = 4.27EE206 pKa = 5.01KK207 pKa = 10.6PSPPKK212 pKa = 9.52LTQRR216 pKa = 11.84CRR218 pKa = 11.84PNILRR223 pKa = 11.84PSAQRR228 pKa = 11.84VSSRR232 pKa = 11.84KK233 pKa = 8.93RR234 pKa = 11.84AAVNCIEE241 pKa = 5.07DD242 pKa = 4.13LLEE245 pKa = 4.59EE246 pKa = 4.21PTEE249 pKa = 4.11PLDD252 pKa = 4.98LSLKK256 pKa = 10.28RR257 pKa = 11.84PRR259 pKa = 11.84PQQ261 pKa = 3.17
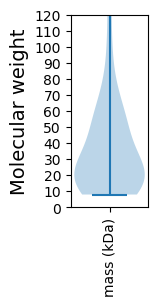
Molecular weight: 28.71 kDa
Isoelectric point according different methods:
Protein with the highest isoelectric point:
>tr|Q695S7|Q695S7_9ADEN Penton protein OS=Simian adenovirus 3 OX=38420 GN=L2 PE=2 SV=1
MM1 pKa = 7.65GKK3 pKa = 8.39LTCRR7 pKa = 11.84LRR9 pKa = 11.84MAVPGYY15 pKa = 9.66RR16 pKa = 11.84GRR18 pKa = 11.84SRR20 pKa = 11.84RR21 pKa = 11.84RR22 pKa = 11.84RR23 pKa = 11.84TLGGSGLRR31 pKa = 11.84RR32 pKa = 11.84RR33 pKa = 11.84RR34 pKa = 11.84AVHH37 pKa = 6.26RR38 pKa = 11.84RR39 pKa = 11.84LKK41 pKa = 10.98GGILPALIPIIAAAIGAIPGIASVAVQASQRR72 pKa = 11.84HH73 pKa = 4.3
MM1 pKa = 7.65GKK3 pKa = 8.39LTCRR7 pKa = 11.84LRR9 pKa = 11.84MAVPGYY15 pKa = 9.66RR16 pKa = 11.84GRR18 pKa = 11.84SRR20 pKa = 11.84RR21 pKa = 11.84RR22 pKa = 11.84RR23 pKa = 11.84TLGGSGLRR31 pKa = 11.84RR32 pKa = 11.84RR33 pKa = 11.84RR34 pKa = 11.84AVHH37 pKa = 6.26RR38 pKa = 11.84RR39 pKa = 11.84LKK41 pKa = 10.98GGILPALIPIIAAAIGAIPGIASVAVQASQRR72 pKa = 11.84HH73 pKa = 4.3
Molecular weight: 7.88 kDa
Isoelectric point according different methods:
Peptides (in silico digests for buttom-up proteomics)
Below you can find in silico digests of the whole proteome with Trypsin, Chymotrypsin, Trypsin+LysC, LysN, ArgC proteases suitable for different mass spec machines.| Try ESI |
 |
|---|
| ChTry ESI |
|
|---|
| ArgC ESI |
|
|---|
| LysN ESI |
|
|---|
| TryLysC ESI |
|
|---|
| Try MALDI |
|
|---|
| ChTry MALDI |
|
|---|
| ArgC MALDI |
|
|---|
| LysN MALDI |
|
|---|
| TryLysC MALDI |
|
|---|
| Try LTQ |
|
|---|
| ChTry LTQ |
|
|---|
| ArgC LTQ |
|
|---|
| LysN LTQ |
|
|---|
| TryLysC LTQ |
|
|---|
| Try MSlow |
|
|---|
| ChTry MSlow |
|
|---|
| ArgC MSlow |
|
|---|
| LysN MSlow |
|
|---|
| TryLysC MSlow |
|
|---|
| Try MShigh |
|
|---|
| ChTry MShigh |
|
|---|
| ArgC MShigh |
|
|---|
| LysN MShigh |
|
|---|
| TryLysC MShigh |
|
|---|
General Statistics
Number of major isoforms |
Number of additional isoforms |
Number of all proteins |
Number of amino acids |
Min. Seq. Length |
Max. Seq. Length |
Avg. Seq. Length |
Avg. Mol. Weight |
|---|---|---|---|---|---|---|---|
11135 |
73 |
1169 |
327.5 |
36.78 |
Amino acid frequency
Ala |
Cys |
Asp |
Glu |
Phe |
Gly |
His |
Ile |
Lys |
Leu |
|---|---|---|---|---|---|---|---|---|---|
7.921 ± 0.423 | 1.94 ± 0.282 |
4.733 ± 0.277 | 6.098 ± 0.536 |
4.041 ± 0.349 | 6.107 ± 0.373 |
2.371 ± 0.243 | 3.96 ± 0.268 |
3.404 ± 0.329 | 9.897 ± 0.534 |
Met |
Asn |
Gln |
Pro |
Arg |
Ser |
Thr |
Val |
Trp |
Tyr |
|---|---|---|---|---|---|---|---|---|---|
2.209 ± 0.241 | 4.652 ± 0.513 |
6.87 ± 0.346 | 4.41 ± 0.232 |
7.319 ± 0.608 | 6.87 ± 0.337 |
5.855 ± 0.404 | 6.412 ± 0.38 |
1.383 ± 0.085 | 3.547 ± 0.308 |
Most of the basic statistics you can see at this page can be downloaded from this CSV file
See this proteome in:

Proteome-pI is available under Creative Commons Attribution-NoDerivs license, for more details see here
| Reference: Kozlowski LP. Proteome-pI 2.0: Proteome Isoelectric Point Database Update. Nucleic Acids Res. 2021, doi: 10.1093/nar/gkab944 | Contact: Lukasz P. Kozlowski |