Acinetobacter nectaris CIP 110549
Taxonomy: cellular organisms; Bacteria; Proteobacteria; Gammaproteobacteria; Pseudomonadales; Moraxellaceae; Acinetobacter; Acinetobacter nectaris
Average proteome isoelectric point is 6.62
Get precalculated fractions of proteins
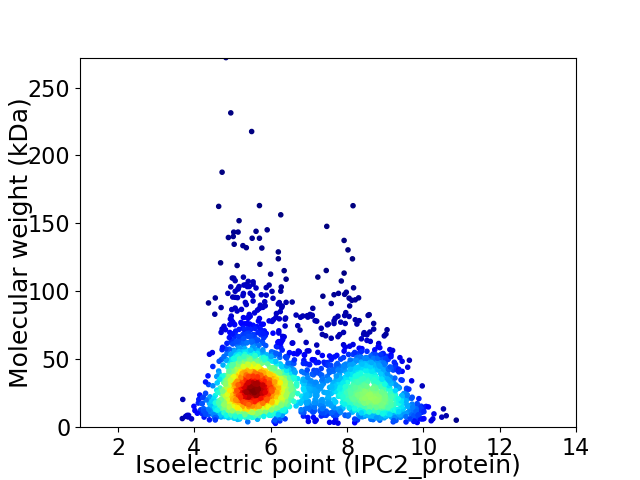
Virtual 2D-PAGE plot for 2541 proteins (isoelectric point calculated using IPC2_protein)
Get csv file with sequences according to given criteria:
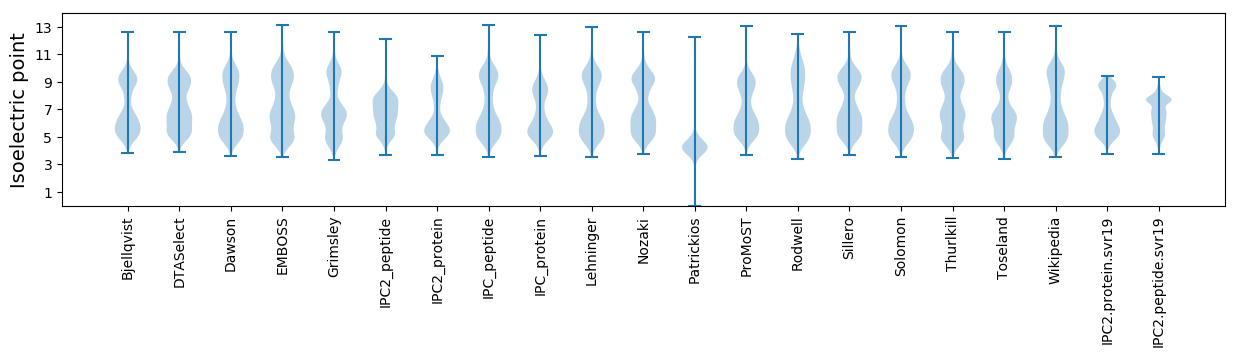
* You can choose from 21 different methods for calculating isoelectric point
Summary statistics related to proteome-wise predictions
Protein with the lowest isoelectric point:
>tr|V2V0X2|V2V0X2_9GAMM Aspartokinase OS=Acinetobacter nectaris CIP 110549 OX=1392540 GN=P256_00178 PE=3 SV=1
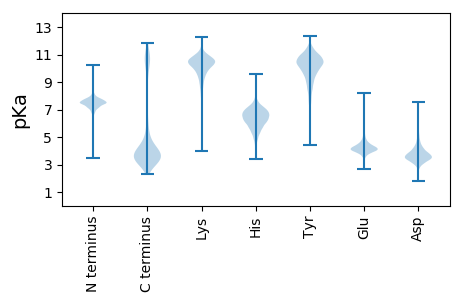
MM1 pKa = 7.7KK2 pKa = 10.11KK3 pKa = 9.69YY4 pKa = 10.57QCIVCGFIYY13 pKa = 10.49DD14 pKa = 4.04EE15 pKa = 4.7AEE17 pKa = 3.78GWPEE21 pKa = 3.85DD22 pKa = 4.42GIAAGTKK29 pKa = 9.36WEE31 pKa = 5.75DD32 pKa = 3.38IPEE35 pKa = 4.28DD36 pKa = 3.9WTCPDD41 pKa = 3.72CGVTKK46 pKa = 10.58VDD48 pKa = 4.06FEE50 pKa = 4.51MIEE53 pKa = 3.99VV54 pKa = 3.54
MM1 pKa = 7.7KK2 pKa = 10.11KK3 pKa = 9.69YY4 pKa = 10.57QCIVCGFIYY13 pKa = 10.49DD14 pKa = 4.04EE15 pKa = 4.7AEE17 pKa = 3.78GWPEE21 pKa = 3.85DD22 pKa = 4.42GIAAGTKK29 pKa = 9.36WEE31 pKa = 5.75DD32 pKa = 3.38IPEE35 pKa = 4.28DD36 pKa = 3.9WTCPDD41 pKa = 3.72CGVTKK46 pKa = 10.58VDD48 pKa = 4.06FEE50 pKa = 4.51MIEE53 pKa = 3.99VV54 pKa = 3.54
Molecular weight: 6.16 kDa
Isoelectric point according different methods:
Protein with the highest isoelectric point:
>tr|V2TG04|V2TG04_9GAMM Uncharacterized protein OS=Acinetobacter nectaris CIP 110549 OX=1392540 GN=P256_00361 PE=3 SV=1
MM1 pKa = 7.45KK2 pKa = 9.55RR3 pKa = 11.84TFQPSEE9 pKa = 3.97LKK11 pKa = 10.13RR12 pKa = 11.84KK13 pKa = 8.98RR14 pKa = 11.84VHH16 pKa = 6.36GFRR19 pKa = 11.84ARR21 pKa = 11.84MATKK25 pKa = 10.4AGRR28 pKa = 11.84QVLARR33 pKa = 11.84RR34 pKa = 11.84RR35 pKa = 11.84AKK37 pKa = 10.18GRR39 pKa = 11.84HH40 pKa = 5.1SLTVV44 pKa = 3.06
MM1 pKa = 7.45KK2 pKa = 9.55RR3 pKa = 11.84TFQPSEE9 pKa = 3.97LKK11 pKa = 10.13RR12 pKa = 11.84KK13 pKa = 8.98RR14 pKa = 11.84VHH16 pKa = 6.36GFRR19 pKa = 11.84ARR21 pKa = 11.84MATKK25 pKa = 10.4AGRR28 pKa = 11.84QVLARR33 pKa = 11.84RR34 pKa = 11.84RR35 pKa = 11.84AKK37 pKa = 10.18GRR39 pKa = 11.84HH40 pKa = 5.1SLTVV44 pKa = 3.06
Molecular weight: 5.18 kDa
Isoelectric point according different methods:
Peptides (in silico digests for buttom-up proteomics)
Below you can find in silico digests of the whole proteome with Trypsin, Chymotrypsin, Trypsin+LysC, LysN, ArgC proteases suitable for different mass spec machines.| Try ESI |
 |
|---|
| ChTry ESI |
|
|---|
| ArgC ESI |
|
|---|
| LysN ESI |
|
|---|
| TryLysC ESI |
|
|---|
| Try MALDI |
|
|---|
| ChTry MALDI |
|
|---|
| ArgC MALDI |
|
|---|
| LysN MALDI |
|
|---|
| TryLysC MALDI |
|
|---|
| Try LTQ |
|
|---|
| ChTry LTQ |
|
|---|
| ArgC LTQ |
|
|---|
| LysN LTQ |
|
|---|
| TryLysC LTQ |
|
|---|
| Try MSlow |
|
|---|
| ChTry MSlow |
|
|---|
| ArgC MSlow |
|
|---|
| LysN MSlow |
|
|---|
| TryLysC MSlow |
|
|---|
| Try MShigh |
|
|---|
| ChTry MShigh |
|
|---|
| ArgC MShigh |
|
|---|
| LysN MShigh |
|
|---|
| TryLysC MShigh |
|
|---|
General Statistics
Number of major isoforms |
Number of additional isoforms |
Number of all proteins |
Number of amino acids |
Min. Seq. Length |
Max. Seq. Length |
Avg. Seq. Length |
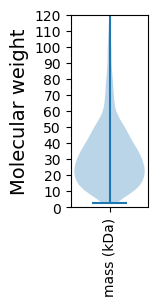
Avg. Mol. Weight |
|---|---|---|---|---|---|---|---|
0 |
781571 |
26 |
2777 |
307.6 |
34.42 |
Amino acid frequency
Ala |
Cys |
Asp |
Glu |
Phe |
Gly |
His |
Ile |
Lys |
Leu |
|---|---|---|---|---|---|---|---|---|---|
7.918 ± 0.052 | 0.946 ± 0.017 |
5.153 ± 0.042 | 5.781 ± 0.064 |
4.316 ± 0.043 | 6.321 ± 0.054 |
2.484 ± 0.028 | 7.339 ± 0.045 |
6.02 ± 0.042 | 10.262 ± 0.057 |
Met |
Asn |
Gln |
Pro |
Arg |
Ser |
Thr |
Val |
Trp |
Tyr |
|---|---|---|---|---|---|---|---|---|---|
2.369 ± 0.027 | 4.806 ± 0.056 |
3.809 ± 0.031 | 5.098 ± 0.045 |
4.133 ± 0.041 | 6.45 ± 0.053 |
5.729 ± 0.067 | 6.497 ± 0.038 |
1.193 ± 0.02 | 3.376 ± 0.031 |
Most of the basic statistics you can see at this page can be downloaded from this CSV file
See this proteome in:

Proteome-pI is available under Creative Commons Attribution-NoDerivs license, for more details see here
| Reference: Kozlowski LP. Proteome-pI 2.0: Proteome Isoelectric Point Database Update. Nucleic Acids Res. 2021, doi: 10.1093/nar/gkab944 | Contact: Lukasz P. Kozlowski |