Mesoplasma corruscae
Taxonomy: cellular organisms; Bacteria; Terrabacteria group; Tenericutes; Mollicutes; Entomoplasmatales; Entomoplasmataceae; Mesoplasma
Average proteome isoelectric point is 7.27
Get precalculated fractions of proteins
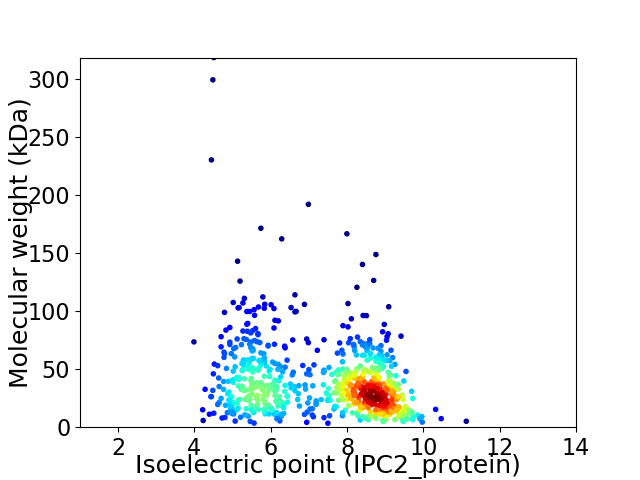
Virtual 2D-PAGE plot for 701 proteins (isoelectric point calculated using IPC2_protein)
Get csv file with sequences according to given criteria:
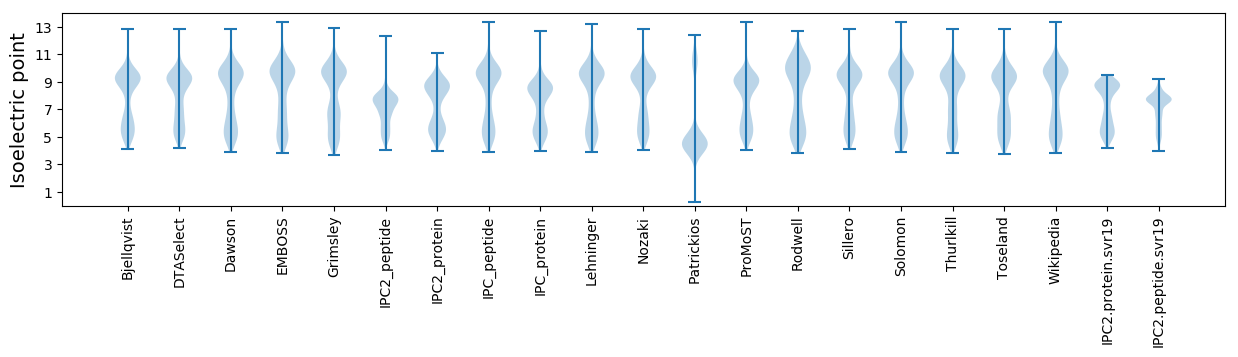
* You can choose from 21 different methods for calculating isoelectric point
Summary statistics related to proteome-wise predictions
Protein with the lowest isoelectric point:
>tr|A0A2S5RGV7|A0A2S5RGV7_9MOLU F0F1 ATP synthase subunit epsilon OS=Mesoplasma corruscae OX=216874 GN=atpC PE=3 SV=1
MM1 pKa = 7.63NNVLDD6 pKa = 4.18LNNYY10 pKa = 8.43EE11 pKa = 4.44FFNGIDD17 pKa = 3.93PNNSLIQTDD26 pKa = 4.47IEE28 pKa = 4.63SFWISLKK35 pKa = 10.01CTVICNIPRR44 pKa = 11.84EE45 pKa = 4.44SEE47 pKa = 3.88KK48 pKa = 11.2SEE50 pKa = 3.87
MM1 pKa = 7.63NNVLDD6 pKa = 4.18LNNYY10 pKa = 8.43EE11 pKa = 4.44FFNGIDD17 pKa = 3.93PNNSLIQTDD26 pKa = 4.47IEE28 pKa = 4.63SFWISLKK35 pKa = 10.01CTVICNIPRR44 pKa = 11.84EE45 pKa = 4.44SEE47 pKa = 3.88KK48 pKa = 11.2SEE50 pKa = 3.87
Molecular weight: 5.81 kDa
Isoelectric point according different methods:
Protein with the highest isoelectric point:
>tr|A0A2S5RHA6|A0A2S5RHA6_9MOLU Peptidyl-tRNA hydrolase OS=Mesoplasma corruscae OX=216874 GN=pth PE=3 SV=1
MM1 pKa = 7.32KK2 pKa = 9.47RR3 pKa = 11.84TWQPSKK9 pKa = 9.91IKK11 pKa = 10.06HH12 pKa = 5.46SRR14 pKa = 11.84VHH16 pKa = 6.2GFRR19 pKa = 11.84ARR21 pKa = 11.84MATKK25 pKa = 10.31NGRR28 pKa = 11.84KK29 pKa = 9.01IIKK32 pKa = 9.57ARR34 pKa = 11.84RR35 pKa = 11.84AKK37 pKa = 10.34GRR39 pKa = 11.84AKK41 pKa = 9.64LTAA44 pKa = 4.21
MM1 pKa = 7.32KK2 pKa = 9.47RR3 pKa = 11.84TWQPSKK9 pKa = 9.91IKK11 pKa = 10.06HH12 pKa = 5.46SRR14 pKa = 11.84VHH16 pKa = 6.2GFRR19 pKa = 11.84ARR21 pKa = 11.84MATKK25 pKa = 10.31NGRR28 pKa = 11.84KK29 pKa = 9.01IIKK32 pKa = 9.57ARR34 pKa = 11.84RR35 pKa = 11.84AKK37 pKa = 10.34GRR39 pKa = 11.84AKK41 pKa = 9.64LTAA44 pKa = 4.21
Molecular weight: 5.13 kDa
Isoelectric point according different methods:
Peptides (in silico digests for buttom-up proteomics)
Below you can find in silico digests of the whole proteome with Trypsin, Chymotrypsin, Trypsin+LysC, LysN, ArgC proteases suitable for different mass spec machines.| Try ESI |
 |
|---|
| ChTry ESI |
|
|---|
| ArgC ESI |
|
|---|
| LysN ESI |
|
|---|
| TryLysC ESI |
|
|---|
| Try MALDI |
|
|---|
| ChTry MALDI |
|
|---|
| ArgC MALDI |
|
|---|
| LysN MALDI |
|
|---|
| TryLysC MALDI |
|
|---|
| Try LTQ |
|
|---|
| ChTry LTQ |
|
|---|
| ArgC LTQ |
|
|---|
| LysN LTQ |
|
|---|
| TryLysC LTQ |
|
|---|
| Try MSlow |
|
|---|
| ChTry MSlow |
|
|---|
| ArgC MSlow |
|
|---|
| LysN MSlow |
|
|---|
| TryLysC MSlow |
|
|---|
| Try MShigh |
|
|---|
| ChTry MShigh |
|
|---|
| ArgC MShigh |
|
|---|
| LysN MShigh |
|
|---|
| TryLysC MShigh |
|
|---|
General Statistics
Number of major isoforms |
Number of additional isoforms |
Number of all proteins |
Number of amino acids |
Min. Seq. Length |
Max. Seq. Length |
Avg. Seq. Length |
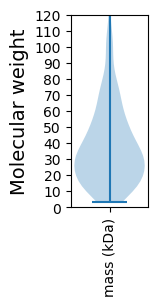
Avg. Mol. Weight |
|---|---|---|---|---|---|---|---|
0 |
249984 |
29 |
2889 |
356.6 |
40.66 |
Amino acid frequency
Ala |
Cys |
Asp |
Glu |
Phe |
Gly |
His |
Ile |
Lys |
Leu |
|---|---|---|---|---|---|---|---|---|---|
5.099 ± 0.096 | 0.607 ± 0.025 |
5.385 ± 0.094 | 6.648 ± 0.092 |
5.351 ± 0.09 | 5.014 ± 0.091 |
1.283 ± 0.04 | 10.421 ± 0.098 |
10.132 ± 0.094 | 9.307 ± 0.075 |
Met |
Asn |
Gln |
Pro |
Arg |
Ser |
Thr |
Val |
Trp |
Tyr |
|---|---|---|---|---|---|---|---|---|---|
2.089 ± 0.039 | 7.487 ± 0.111 |
2.437 ± 0.055 | 3.295 ± 0.043 |
2.595 ± 0.059 | 6.891 ± 0.091 |
5.348 ± 0.101 | 5.876 ± 0.074 |
1.031 ± 0.034 | 3.703 ± 0.058 |
Most of the basic statistics you can see at this page can be downloaded from this CSV file
See this proteome in:

Proteome-pI is available under Creative Commons Attribution-NoDerivs license, for more details see here
| Reference: Kozlowski LP. Proteome-pI 2.0: Proteome Isoelectric Point Database Update. Nucleic Acids Res. 2021, doi: 10.1093/nar/gkab944 | Contact: Lukasz P. Kozlowski |