Escherichia phage JS98
Taxonomy: Viruses; Duplodnaviria; Heunggongvirae; Uroviricota; Caudoviricetes; Caudovirales; Myoviridae; Tevenvirinae; Dhakavirus; Escherichia virus JS98
Average proteome isoelectric point is 6.02
Get precalculated fractions of proteins
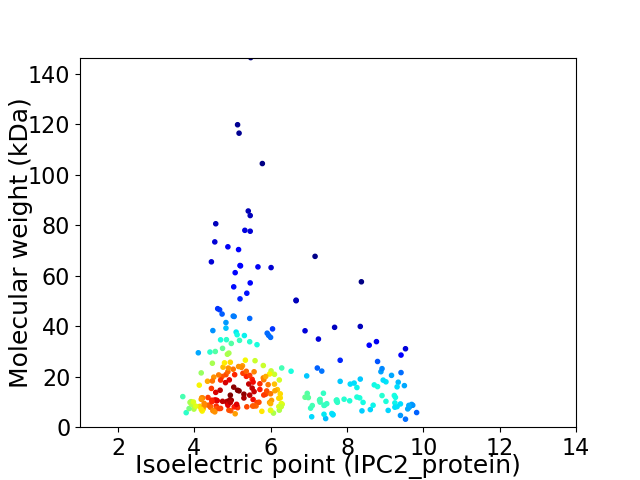
Virtual 2D-PAGE plot for 266 proteins (isoelectric point calculated using IPC2_protein)
Get csv file with sequences according to given criteria:
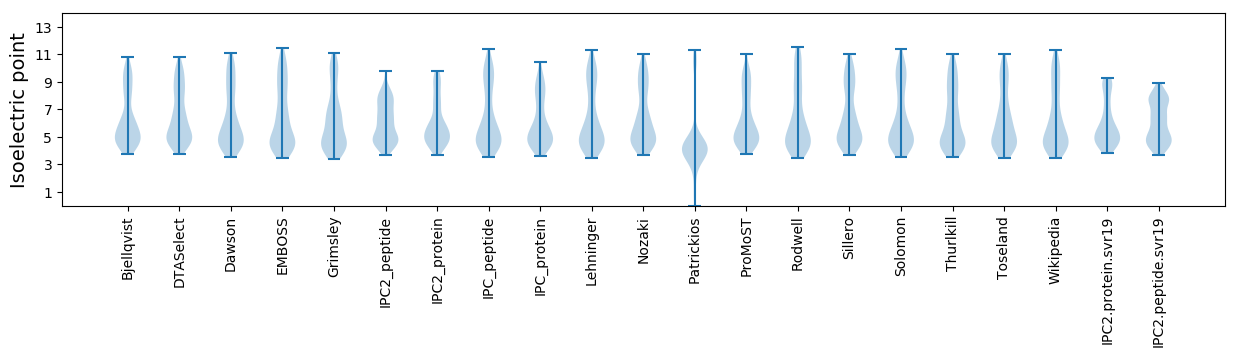
* You can choose from 21 different methods for calculating isoelectric point
Summary statistics related to proteome-wise predictions
Protein with the lowest isoelectric point:
>tr|Q5QC41|Q5QC41_9CAUD Gp46 recombination endonuclease subunit OS=Escherichia phage JS98 OX=293178 GN=46 PE=4 SV=1
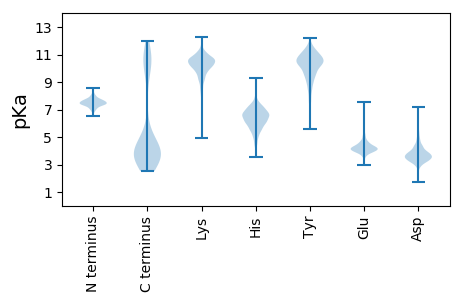
MM1 pKa = 7.54KK2 pKa = 9.68MYY4 pKa = 10.6KK5 pKa = 9.59HH6 pKa = 6.93DD7 pKa = 3.7FHH9 pKa = 9.27IGDD12 pKa = 3.28GWFGNVEE19 pKa = 3.93WDD21 pKa = 4.5VDD23 pKa = 4.04GSWYY27 pKa = 9.23TGTMYY32 pKa = 9.56VTSEE36 pKa = 3.99YY37 pKa = 11.05SEE39 pKa = 4.26GVSWAMEE46 pKa = 4.23LDD48 pKa = 3.77DD49 pKa = 4.94VFASSEE55 pKa = 4.01EE56 pKa = 3.8MLEE59 pKa = 4.11YY60 pKa = 10.87AEE62 pKa = 4.02QTIRR66 pKa = 11.84EE67 pKa = 4.28NNTT70 pKa = 2.83
MM1 pKa = 7.54KK2 pKa = 9.68MYY4 pKa = 10.6KK5 pKa = 9.59HH6 pKa = 6.93DD7 pKa = 3.7FHH9 pKa = 9.27IGDD12 pKa = 3.28GWFGNVEE19 pKa = 3.93WDD21 pKa = 4.5VDD23 pKa = 4.04GSWYY27 pKa = 9.23TGTMYY32 pKa = 9.56VTSEE36 pKa = 3.99YY37 pKa = 11.05SEE39 pKa = 4.26GVSWAMEE46 pKa = 4.23LDD48 pKa = 3.77DD49 pKa = 4.94VFASSEE55 pKa = 4.01EE56 pKa = 3.8MLEE59 pKa = 4.11YY60 pKa = 10.87AEE62 pKa = 4.02QTIRR66 pKa = 11.84EE67 pKa = 4.28NNTT70 pKa = 2.83
Molecular weight: 8.22 kDa
Isoelectric point according different methods:
Protein with the highest isoelectric point:
>tr|A8R9Q6|A8R9Q6_9CAUD Nucleoid disruption protein OS=Escherichia phage JS98 OX=293178 GN=ndd PE=4 SV=1
MM1 pKa = 7.56SNFHH5 pKa = 6.63NEE7 pKa = 4.71HH8 pKa = 4.57VMQWHH13 pKa = 5.93RR14 pKa = 11.84HH15 pKa = 4.07NLKK18 pKa = 9.03LTGVFGRR25 pKa = 11.84PP26 pKa = 3.12
MM1 pKa = 7.56SNFHH5 pKa = 6.63NEE7 pKa = 4.71HH8 pKa = 4.57VMQWHH13 pKa = 5.93RR14 pKa = 11.84HH15 pKa = 4.07NLKK18 pKa = 9.03LTGVFGRR25 pKa = 11.84PP26 pKa = 3.12
Molecular weight: 3.17 kDa
Isoelectric point according different methods:
Peptides (in silico digests for buttom-up proteomics)
Below you can find in silico digests of the whole proteome with Trypsin, Chymotrypsin, Trypsin+LysC, LysN, ArgC proteases suitable for different mass spec machines.| Try ESI |
 |
|---|
| ChTry ESI |
|
|---|
| ArgC ESI |
|
|---|
| LysN ESI |
|
|---|
| TryLysC ESI |
|
|---|
| Try MALDI |
|
|---|
| ChTry MALDI |
|
|---|
| ArgC MALDI |
|
|---|
| LysN MALDI |
|
|---|
| TryLysC MALDI |
|
|---|
| Try LTQ |
|
|---|
| ChTry LTQ |
|
|---|
| ArgC LTQ |
|
|---|
| LysN LTQ |
|
|---|
| TryLysC LTQ |
|
|---|
| Try MSlow |
|
|---|
| ChTry MSlow |
|
|---|
| ArgC MSlow |
|
|---|
| LysN MSlow |
|
|---|
| TryLysC MSlow |
|
|---|
| Try MShigh |
|
|---|
| ChTry MShigh |
|
|---|
| ArgC MShigh |
|
|---|
| LysN MShigh |
|
|---|
| TryLysC MShigh |
|
|---|
General Statistics
Number of major isoforms |
Number of additional isoforms |
Number of all proteins |
Number of amino acids |
Min. Seq. Length |
Max. Seq. Length |
Avg. Seq. Length |
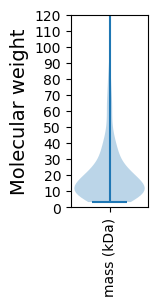
Avg. Mol. Weight |
|---|---|---|---|---|---|---|---|
0 |
52266 |
26 |
1349 |
196.5 |
22.24 |
Amino acid frequency
Ala |
Cys |
Asp |
Glu |
Phe |
Gly |
His |
Ile |
Lys |
Leu |
|---|---|---|---|---|---|---|---|---|---|
7.133 ± 0.166 | 1.047 ± 0.066 |
6.515 ± 0.105 | 7.297 ± 0.19 |
4.358 ± 0.101 | 6.272 ± 0.223 |
1.684 ± 0.069 | 6.846 ± 0.115 |
7.406 ± 0.199 | 7.623 ± 0.156 |
Met |
Asn |
Gln |
Pro |
Arg |
Ser |
Thr |
Val |
Trp |
Tyr |
|---|---|---|---|---|---|---|---|---|---|
2.769 ± 0.102 | 5.348 ± 0.119 |
3.601 ± 0.1 | 3.452 ± 0.088 |
4.303 ± 0.101 | 6.09 ± 0.137 |
5.841 ± 0.218 | 6.698 ± 0.105 |
1.427 ± 0.072 | 4.292 ± 0.122 |
Most of the basic statistics you can see at this page can be downloaded from this CSV file
See this proteome in:

Proteome-pI is available under Creative Commons Attribution-NoDerivs license, for more details see here
| Reference: Kozlowski LP. Proteome-pI 2.0: Proteome Isoelectric Point Database Update. Nucleic Acids Res. 2021, doi: 10.1093/nar/gkab944 | Contact: Lukasz P. Kozlowski |