Ralstonia phage RSM1
Taxonomy: Viruses; Monodnaviria; Loebvirae; Hofneiviricota; Faserviricetes; Tubulavirales; Inoviridae; Habenivirus; Ralstonia virus RSM1
Average proteome isoelectric point is 7.59
Get precalculated fractions of proteins
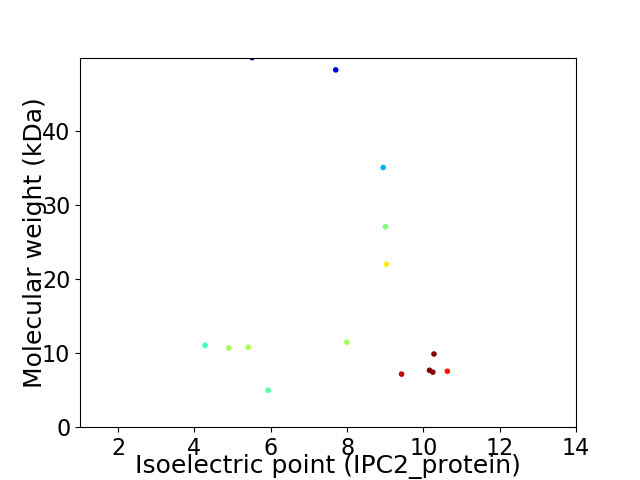
Virtual 2D-PAGE plot for 15 proteins (isoelectric point calculated using IPC2_protein)
Get csv file with sequences according to given criteria:
* You can choose from 21 different methods for calculating isoelectric point
Summary statistics related to proteome-wise predictions
Protein with the lowest isoelectric point:
>tr|A0JC15|A0JC15_9VIRU Zot domain-containing protein OS=Ralstonia phage RSM1 OX=384359 PE=4 SV=1
MM1 pKa = 7.52FDD3 pKa = 3.65AVINALSALAQWLDD17 pKa = 3.95GIFVAIFAALWQITEE32 pKa = 4.38DD33 pKa = 4.28LFIDD37 pKa = 4.43SLDD40 pKa = 4.01LLLQGVTAVLGTLPAPTFLSGVSLQSAFNSLGGDD74 pKa = 2.86ILFFFGVFNIGQGIGLLGGRR94 pKa = 11.84SRR96 pKa = 11.84FVWRR100 pKa = 11.84ARR102 pKa = 11.84SS103 pKa = 3.23
MM1 pKa = 7.52FDD3 pKa = 3.65AVINALSALAQWLDD17 pKa = 3.95GIFVAIFAALWQITEE32 pKa = 4.38DD33 pKa = 4.28LFIDD37 pKa = 4.43SLDD40 pKa = 4.01LLLQGVTAVLGTLPAPTFLSGVSLQSAFNSLGGDD74 pKa = 2.86ILFFFGVFNIGQGIGLLGGRR94 pKa = 11.84SRR96 pKa = 11.84FVWRR100 pKa = 11.84ARR102 pKa = 11.84SS103 pKa = 3.23
Molecular weight: 11.04 kDa
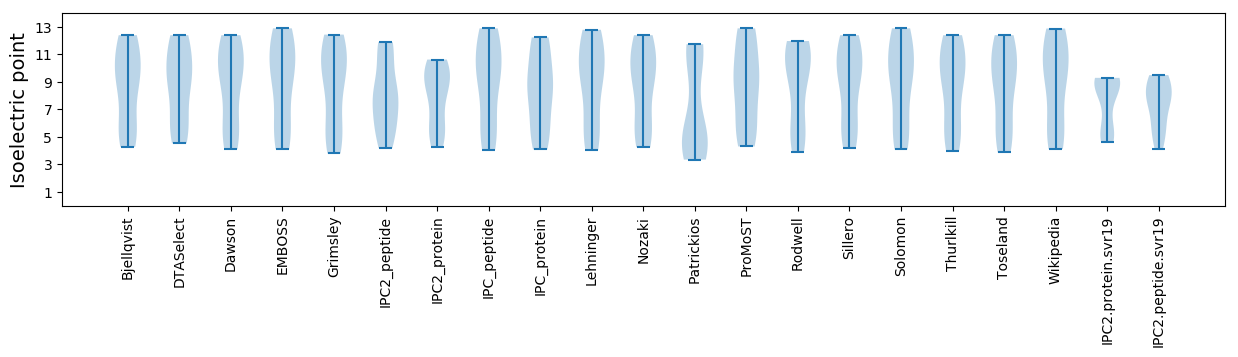
Isoelectric point according different methods:
Protein with the highest isoelectric point:
>tr|A0JC10|A0JC10_9VIRU Uncharacterized protein OS=Ralstonia phage RSM1 OX=384359 PE=4 SV=1
MM1 pKa = 7.42KK2 pKa = 10.58LSTPLLLLLVGWLATAVAHH21 pKa = 5.67NAWRR25 pKa = 11.84LFSVIGFAGVSMLIQGGHH43 pKa = 4.72GVARR47 pKa = 11.84VCLLLAVVLVVVRR60 pKa = 11.84LVRR63 pKa = 11.84RR64 pKa = 11.84FFRR67 pKa = 11.84RR68 pKa = 11.84AA69 pKa = 2.88
MM1 pKa = 7.42KK2 pKa = 10.58LSTPLLLLLVGWLATAVAHH21 pKa = 5.67NAWRR25 pKa = 11.84LFSVIGFAGVSMLIQGGHH43 pKa = 4.72GVARR47 pKa = 11.84VCLLLAVVLVVVRR60 pKa = 11.84LVRR63 pKa = 11.84RR64 pKa = 11.84FFRR67 pKa = 11.84RR68 pKa = 11.84AA69 pKa = 2.88
Molecular weight: 7.55 kDa
Isoelectric point according different methods:
Peptides (in silico digests for buttom-up proteomics)
Below you can find in silico digests of the whole proteome with Trypsin, Chymotrypsin, Trypsin+LysC, LysN, ArgC proteases suitable for different mass spec machines.| Try ESI |
 |
|---|
| ChTry ESI |
|
|---|
| ArgC ESI |
|
|---|
| LysN ESI |
|
|---|
| TryLysC ESI |
|
|---|
| Try MALDI |
|
|---|
| ChTry MALDI |
|
|---|
| ArgC MALDI |
|
|---|
| LysN MALDI |
|
|---|
| TryLysC MALDI |
|
|---|
| Try LTQ |
|
|---|
| ChTry LTQ |
|
|---|
| ArgC LTQ |
|
|---|
| LysN LTQ |
|
|---|
| TryLysC LTQ |
|
|---|
| Try MSlow |
|
|---|
| ChTry MSlow |
|
|---|
| ArgC MSlow |
|
|---|
| LysN MSlow |
|
|---|
| TryLysC MSlow |
|
|---|
| Try MShigh |
|
|---|
| ChTry MShigh |
|
|---|
| ArgC MShigh |
|
|---|
| LysN MShigh |
|
|---|
| TryLysC MShigh |
|
|---|
General Statistics
Number of major isoforms |
Number of additional isoforms |
Number of all proteins |
Number of amino acids |
Min. Seq. Length |
Max. Seq. Length |
Avg. Seq. Length |
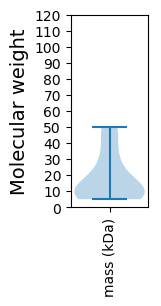
Avg. Mol. Weight |
|---|---|---|---|---|---|---|---|
0 |
2489 |
46 |
498 |
165.9 |
18.05 |
Amino acid frequency
Ala |
Cys |
Asp |
Glu |
Phe |
Gly |
His |
Ile |
Lys |
Leu |
|---|---|---|---|---|---|---|---|---|---|
12.897 ± 0.65 | 1.245 ± 0.283 |
4.419 ± 0.281 | 4.018 ± 0.985 |
3.254 ± 0.746 | 8.196 ± 1.113 |
1.928 ± 0.434 | 3.978 ± 0.343 |
4.379 ± 0.637 | 7.352 ± 0.949 |
Met |
Asn |
Gln |
Pro |
Arg |
Ser |
Thr |
Val |
Trp |
Tyr |
|---|---|---|---|---|---|---|---|---|---|
2.531 ± 0.4 | 2.893 ± 0.374 |
4.259 ± 0.715 | 4.701 ± 0.84 |
7.031 ± 1.367 | 6.227 ± 0.638 |
6.83 ± 1.256 | 9.16 ± 0.896 |
2.451 ± 0.362 | 2.25 ± 0.323 |
Most of the basic statistics you can see at this page can be downloaded from this CSV file
See this proteome in:

Proteome-pI is available under Creative Commons Attribution-NoDerivs license, for more details see here
| Reference: Kozlowski LP. Proteome-pI 2.0: Proteome Isoelectric Point Database Update. Nucleic Acids Res. 2021, doi: 10.1093/nar/gkab944 | Contact: Lukasz P. Kozlowski |