Saccharopolyspora spinosa
Taxonomy: cellular organisms; Bacteria; Terrabacteria group; Actinobacteria;
Average proteome isoelectric point is 6.31
Get precalculated fractions of proteins
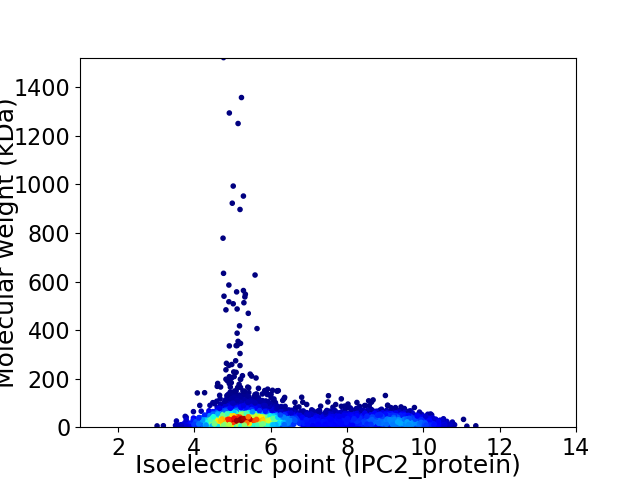
Virtual 2D-PAGE plot for 7300 proteins (isoelectric point calculated using IPC2_protein)
Get csv file with sequences according to given criteria:
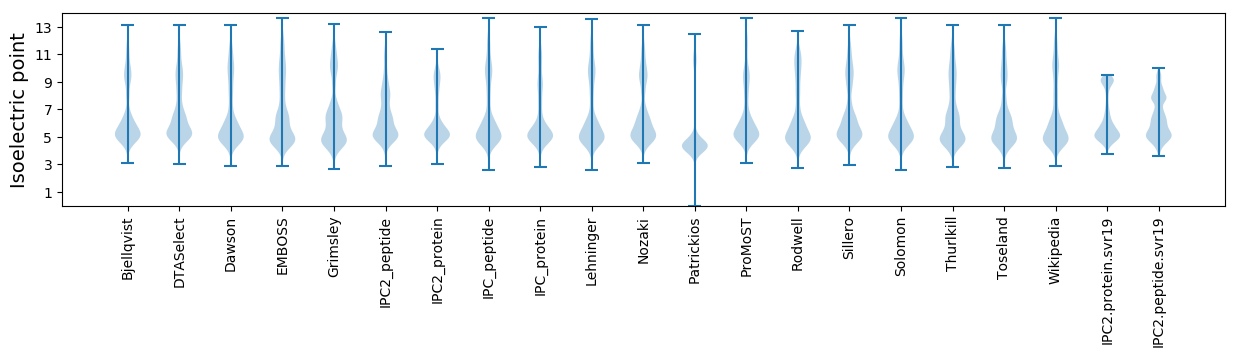
* You can choose from 21 different methods for calculating isoelectric point
Summary statistics related to proteome-wise predictions
Protein with the lowest isoelectric point:
>tr|A0A2N3XW49|A0A2N3XW49_SACSN Uncharacterized protein OS=Saccharopolyspora spinosa OX=60894 GN=A8926_2481 PE=4 SV=1
MM1 pKa = 7.18SWSIEE6 pKa = 3.84IDD8 pKa = 3.06ADD10 pKa = 3.84TCIGSGMCAGVAPDD24 pKa = 3.89HH25 pKa = 6.73FEE27 pKa = 4.44LVDD30 pKa = 4.47GYY32 pKa = 11.6SCAKK36 pKa = 9.38KK37 pKa = 9.72ATVEE41 pKa = 4.08PTDD44 pKa = 3.65EE45 pKa = 4.23VVDD48 pKa = 3.86AAEE51 pKa = 4.34SCPVEE56 pKa = 4.8AILVKK61 pKa = 10.64DD62 pKa = 4.18AEE64 pKa = 4.5TGAAIAPEE72 pKa = 4.15KK73 pKa = 10.79
MM1 pKa = 7.18SWSIEE6 pKa = 3.84IDD8 pKa = 3.06ADD10 pKa = 3.84TCIGSGMCAGVAPDD24 pKa = 3.89HH25 pKa = 6.73FEE27 pKa = 4.44LVDD30 pKa = 4.47GYY32 pKa = 11.6SCAKK36 pKa = 9.38KK37 pKa = 9.72ATVEE41 pKa = 4.08PTDD44 pKa = 3.65EE45 pKa = 4.23VVDD48 pKa = 3.86AAEE51 pKa = 4.34SCPVEE56 pKa = 4.8AILVKK61 pKa = 10.64DD62 pKa = 4.18AEE64 pKa = 4.5TGAAIAPEE72 pKa = 4.15KK73 pKa = 10.79
Molecular weight: 7.53 kDa
Isoelectric point according different methods:
Protein with the highest isoelectric point:
>tr|A0A2N3XS48|A0A2N3XS48_SACSN Cell elongation-specific peptidoglycan biosynthesis regulator RodA OS=Saccharopolyspora spinosa OX=60894 GN=A8926_1043 PE=4 SV=1
MM1 pKa = 7.53SKK3 pKa = 10.53GKK5 pKa = 8.66RR6 pKa = 11.84TFQPNNRR13 pKa = 11.84RR14 pKa = 11.84RR15 pKa = 11.84ARR17 pKa = 11.84KK18 pKa = 8.65HH19 pKa = 4.47GFRR22 pKa = 11.84LRR24 pKa = 11.84MRR26 pKa = 11.84TRR28 pKa = 11.84AGRR31 pKa = 11.84AIVASRR37 pKa = 11.84RR38 pKa = 11.84RR39 pKa = 11.84RR40 pKa = 11.84GRR42 pKa = 11.84AQLTAA47 pKa = 4.03
MM1 pKa = 7.53SKK3 pKa = 10.53GKK5 pKa = 8.66RR6 pKa = 11.84TFQPNNRR13 pKa = 11.84RR14 pKa = 11.84RR15 pKa = 11.84ARR17 pKa = 11.84KK18 pKa = 8.65HH19 pKa = 4.47GFRR22 pKa = 11.84LRR24 pKa = 11.84MRR26 pKa = 11.84TRR28 pKa = 11.84AGRR31 pKa = 11.84AIVASRR37 pKa = 11.84RR38 pKa = 11.84RR39 pKa = 11.84RR40 pKa = 11.84GRR42 pKa = 11.84AQLTAA47 pKa = 4.03
Molecular weight: 5.59 kDa
Isoelectric point according different methods:
Peptides (in silico digests for buttom-up proteomics)
Below you can find in silico digests of the whole proteome with Trypsin, Chymotrypsin, Trypsin+LysC, LysN, ArgC proteases suitable for different mass spec machines.| Try ESI |
 |
|---|
| ChTry ESI |
|
|---|
| ArgC ESI |
|
|---|
| LysN ESI |
|
|---|
| TryLysC ESI |
|
|---|
| Try MALDI |
|
|---|
| ChTry MALDI |
|
|---|
| ArgC MALDI |
|
|---|
| LysN MALDI |
|
|---|
| TryLysC MALDI |
|
|---|
| Try LTQ |
|
|---|
| ChTry LTQ |
|
|---|
| ArgC LTQ |
|
|---|
| LysN LTQ |
|
|---|
| TryLysC LTQ |
|
|---|
| Try MSlow |
|
|---|
| ChTry MSlow |
|
|---|
| ArgC MSlow |
|
|---|
| LysN MSlow |
|
|---|
| TryLysC MSlow |
|
|---|
| Try MShigh |
|
|---|
| ChTry MShigh |
|
|---|
| ArgC MShigh |
|
|---|
| LysN MShigh |
|
|---|
| TryLysC MShigh |
|
|---|
General Statistics
Number of major isoforms |
Number of additional isoforms |
Number of all proteins |
Number of amino acids |
Min. Seq. Length |
Max. Seq. Length |
Avg. Seq. Length |
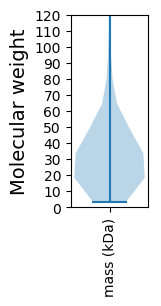
Avg. Mol. Weight |
|---|---|---|---|---|---|---|---|
0 |
2427316 |
29 |
14043 |
332.5 |
35.81 |
Amino acid frequency
Ala |
Cys |
Asp |
Glu |
Phe |
Gly |
His |
Ile |
Lys |
Leu |
|---|---|---|---|---|---|---|---|---|---|
12.88 ± 0.043 | 0.839 ± 0.014 |
5.983 ± 0.028 | 6.103 ± 0.059 |
2.845 ± 0.019 | 9.157 ± 0.049 |
2.261 ± 0.02 | 3.529 ± 0.041 |
2.257 ± 0.043 | 10.17 ± 0.045 |
Met |
Asn |
Gln |
Pro |
Arg |
Ser |
Thr |
Val |
Trp |
Tyr |
|---|---|---|---|---|---|---|---|---|---|
1.75 ± 0.016 | 2.003 ± 0.018 |
5.794 ± 0.029 | 3.324 ± 0.034 |
8.047 ± 0.033 | 5.333 ± 0.027 |
5.543 ± 0.039 | 8.719 ± 0.039 |
1.573 ± 0.017 | 1.892 ± 0.015 |
Most of the basic statistics you can see at this page can be downloaded from this CSV file
See this proteome in:

Proteome-pI is available under Creative Commons Attribution-NoDerivs license, for more details see here
| Reference: Kozlowski LP. Proteome-pI 2.0: Proteome Isoelectric Point Database Update. Nucleic Acids Res. 2021, doi: 10.1093/nar/gkab944 | Contact: Lukasz P. Kozlowski |