Rhizobium sp. NXC24
Taxonomy: cellular organisms; Bacteria; Proteobacteria; Alphaproteobacteria; Hyphomicrobiales; Rhizobiaceae; Rhizobium/Agrobacterium group; Rhizobium; unclassified Rhizobium
Average proteome isoelectric point is 6.51
Get precalculated fractions of proteins
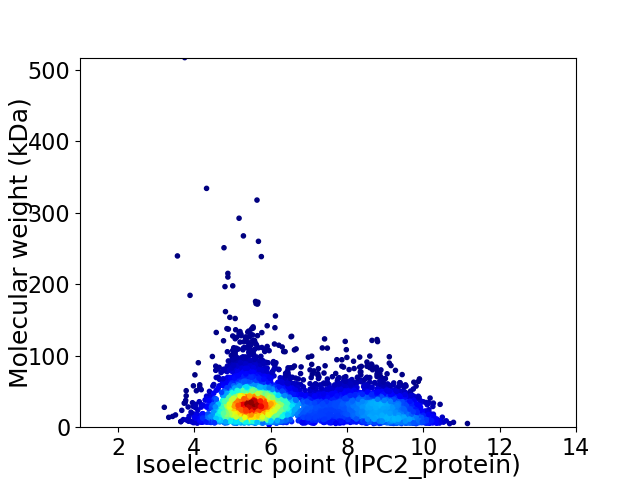
Virtual 2D-PAGE plot for 6922 proteins (isoelectric point calculated using IPC2_protein)
Get csv file with sequences according to given criteria:
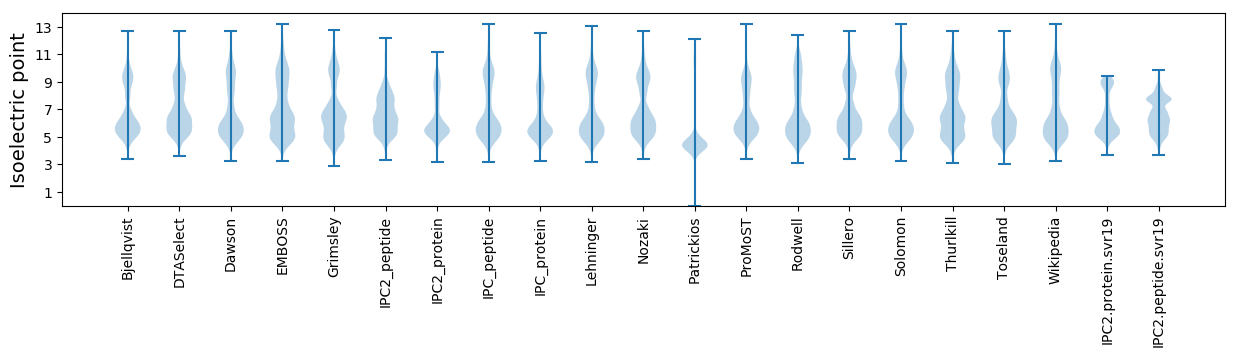
* You can choose from 21 different methods for calculating isoelectric point
Summary statistics related to proteome-wise predictions
Protein with the lowest isoelectric point:
>tr|A0A2L0W7N5|A0A2L0W7N5_9RHIZ DnaJ family heat shock protein OS=Rhizobium sp. NXC24 OX=2048897 GN=NXC24_CH00910 PE=4 SV=1
MM1 pKa = 7.61SIFGSMKK8 pKa = 9.3TAVSGMNAQANRR20 pKa = 11.84LGTVSDD26 pKa = 4.7NIANSSTTGYY36 pKa = 10.54KK37 pKa = 9.74EE38 pKa = 3.79ASTSFSSLVLPSSAGSYY55 pKa = 10.52SSGGVQTSVHH65 pKa = 6.07RR66 pKa = 11.84AISQQGNISYY76 pKa = 7.58TTSSTDD82 pKa = 4.23LAIQGNGFFVVQSSSGQTFLSRR104 pKa = 11.84SGDD107 pKa = 3.6FSADD111 pKa = 3.06SSGNLVNSAGFTLMGYY127 pKa = 9.34PYY129 pKa = 9.95SSSGTASVVVNGFSGLEE146 pKa = 4.07PINVSEE152 pKa = 4.35NGVTAVATTTGEE164 pKa = 4.07MEE166 pKa = 4.56GNLDD170 pKa = 3.87SNADD174 pKa = 3.33IATSSTTGYY183 pKa = 10.39LPSEE187 pKa = 3.94NTYY190 pKa = 10.73PVTDD194 pKa = 3.83DD195 pKa = 3.61TNKK198 pKa = 9.88VSITGYY204 pKa = 10.42DD205 pKa = 3.43SQGNATTFDD214 pKa = 3.22VYY216 pKa = 9.39YY217 pKa = 10.49TKK219 pKa = 10.27TADD222 pKa = 3.58NTWDD226 pKa = 3.33VTVYY230 pKa = 10.7NQADD234 pKa = 4.27LVSDD238 pKa = 4.02PTSGGALYY246 pKa = 10.85SSDD249 pKa = 3.39PVGSTEE255 pKa = 6.01LDD257 pKa = 3.52FDD259 pKa = 4.0DD260 pKa = 4.98TGALTSGGTFDD271 pKa = 5.86LSFTSGSTTQTIAMDD286 pKa = 3.58MTGFTQVATDD296 pKa = 4.09FNATGSMNGQAPNPVTSVTISKK318 pKa = 10.45DD319 pKa = 3.2GTVNAVYY326 pKa = 10.44KK327 pKa = 10.76DD328 pKa = 3.83SSTKK332 pKa = 10.04ALYY335 pKa = 9.9RR336 pKa = 11.84IPLATVASPDD346 pKa = 3.51NLTLEE351 pKa = 4.42SGNVYY356 pKa = 10.21SANGEE361 pKa = 4.22SGVTVTGFPQTGGFGYY377 pKa = 9.57IQSGALEE384 pKa = 4.23EE385 pKa = 4.93SNVDD389 pKa = 4.04LATEE393 pKa = 4.52LTNMIEE399 pKa = 4.12AQKK402 pKa = 10.97SYY404 pKa = 9.42TANSKK409 pKa = 9.73VFQAGSDD416 pKa = 3.75LLDD419 pKa = 3.26VLVNLQRR426 pKa = 4.57
MM1 pKa = 7.61SIFGSMKK8 pKa = 9.3TAVSGMNAQANRR20 pKa = 11.84LGTVSDD26 pKa = 4.7NIANSSTTGYY36 pKa = 10.54KK37 pKa = 9.74EE38 pKa = 3.79ASTSFSSLVLPSSAGSYY55 pKa = 10.52SSGGVQTSVHH65 pKa = 6.07RR66 pKa = 11.84AISQQGNISYY76 pKa = 7.58TTSSTDD82 pKa = 4.23LAIQGNGFFVVQSSSGQTFLSRR104 pKa = 11.84SGDD107 pKa = 3.6FSADD111 pKa = 3.06SSGNLVNSAGFTLMGYY127 pKa = 9.34PYY129 pKa = 9.95SSSGTASVVVNGFSGLEE146 pKa = 4.07PINVSEE152 pKa = 4.35NGVTAVATTTGEE164 pKa = 4.07MEE166 pKa = 4.56GNLDD170 pKa = 3.87SNADD174 pKa = 3.33IATSSTTGYY183 pKa = 10.39LPSEE187 pKa = 3.94NTYY190 pKa = 10.73PVTDD194 pKa = 3.83DD195 pKa = 3.61TNKK198 pKa = 9.88VSITGYY204 pKa = 10.42DD205 pKa = 3.43SQGNATTFDD214 pKa = 3.22VYY216 pKa = 9.39YY217 pKa = 10.49TKK219 pKa = 10.27TADD222 pKa = 3.58NTWDD226 pKa = 3.33VTVYY230 pKa = 10.7NQADD234 pKa = 4.27LVSDD238 pKa = 4.02PTSGGALYY246 pKa = 10.85SSDD249 pKa = 3.39PVGSTEE255 pKa = 6.01LDD257 pKa = 3.52FDD259 pKa = 4.0DD260 pKa = 4.98TGALTSGGTFDD271 pKa = 5.86LSFTSGSTTQTIAMDD286 pKa = 3.58MTGFTQVATDD296 pKa = 4.09FNATGSMNGQAPNPVTSVTISKK318 pKa = 10.45DD319 pKa = 3.2GTVNAVYY326 pKa = 10.44KK327 pKa = 10.76DD328 pKa = 3.83SSTKK332 pKa = 10.04ALYY335 pKa = 9.9RR336 pKa = 11.84IPLATVASPDD346 pKa = 3.51NLTLEE351 pKa = 4.42SGNVYY356 pKa = 10.21SANGEE361 pKa = 4.22SGVTVTGFPQTGGFGYY377 pKa = 9.57IQSGALEE384 pKa = 4.23EE385 pKa = 4.93SNVDD389 pKa = 4.04LATEE393 pKa = 4.52LTNMIEE399 pKa = 4.12AQKK402 pKa = 10.97SYY404 pKa = 9.42TANSKK409 pKa = 9.73VFQAGSDD416 pKa = 3.75LLDD419 pKa = 3.26VLVNLQRR426 pKa = 4.57
Molecular weight: 43.91 kDa
Isoelectric point according different methods:
Protein with the highest isoelectric point:
>tr|A0A2L0W6L9|A0A2L0W6L9_9RHIZ Uncharacterized protein OS=Rhizobium sp. NXC24 OX=2048897 GN=NXC24_CH00539 PE=4 SV=1
MM1 pKa = 7.35KK2 pKa = 9.43RR3 pKa = 11.84TYY5 pKa = 10.27QPSKK9 pKa = 9.73LVRR12 pKa = 11.84KK13 pKa = 9.15RR14 pKa = 11.84RR15 pKa = 11.84HH16 pKa = 4.42GFRR19 pKa = 11.84ARR21 pKa = 11.84MATKK25 pKa = 10.11GGRR28 pKa = 11.84AVLSARR34 pKa = 11.84RR35 pKa = 11.84NRR37 pKa = 11.84GRR39 pKa = 11.84KK40 pKa = 9.03RR41 pKa = 11.84LSAA44 pKa = 4.03
MM1 pKa = 7.35KK2 pKa = 9.43RR3 pKa = 11.84TYY5 pKa = 10.27QPSKK9 pKa = 9.73LVRR12 pKa = 11.84KK13 pKa = 9.15RR14 pKa = 11.84RR15 pKa = 11.84HH16 pKa = 4.42GFRR19 pKa = 11.84ARR21 pKa = 11.84MATKK25 pKa = 10.11GGRR28 pKa = 11.84AVLSARR34 pKa = 11.84RR35 pKa = 11.84NRR37 pKa = 11.84GRR39 pKa = 11.84KK40 pKa = 9.03RR41 pKa = 11.84LSAA44 pKa = 4.03
Molecular weight: 5.17 kDa
Isoelectric point according different methods:
Peptides (in silico digests for buttom-up proteomics)
Below you can find in silico digests of the whole proteome with Trypsin, Chymotrypsin, Trypsin+LysC, LysN, ArgC proteases suitable for different mass spec machines.| Try ESI |
 |
|---|
| ChTry ESI |
|
|---|
| ArgC ESI |
|
|---|
| LysN ESI |
|
|---|
| TryLysC ESI |
|
|---|
| Try MALDI |
|
|---|
| ChTry MALDI |
|
|---|
| ArgC MALDI |
|
|---|
| LysN MALDI |
|
|---|
| TryLysC MALDI |
|
|---|
| Try LTQ |
|
|---|
| ChTry LTQ |
|
|---|
| ArgC LTQ |
|
|---|
| LysN LTQ |
|
|---|
| TryLysC LTQ |
|
|---|
| Try MSlow |
|
|---|
| ChTry MSlow |
|
|---|
| ArgC MSlow |
|
|---|
| LysN MSlow |
|
|---|
| TryLysC MSlow |
|
|---|
| Try MShigh |
|
|---|
| ChTry MShigh |
|
|---|
| ArgC MShigh |
|
|---|
| LysN MShigh |
|
|---|
| TryLysC MShigh |
|
|---|
General Statistics
Number of major isoforms |
Number of additional isoforms |
Number of all proteins |
Number of amino acids |
Min. Seq. Length |
Max. Seq. Length |
Avg. Seq. Length |
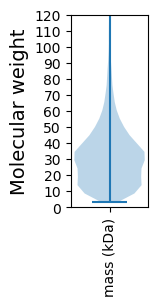
Avg. Mol. Weight |
|---|---|---|---|---|---|---|---|
0 |
2111068 |
29 |
5174 |
305.0 |
33.27 |
Amino acid frequency
Ala |
Cys |
Asp |
Glu |
Phe |
Gly |
His |
Ile |
Lys |
Leu |
|---|---|---|---|---|---|---|---|---|---|
11.608 ± 0.035 | 0.854 ± 0.01 |
5.721 ± 0.026 | 5.654 ± 0.029 |
3.944 ± 0.02 | 8.144 ± 0.033 |
2.095 ± 0.013 | 5.837 ± 0.022 |
3.817 ± 0.026 | 9.914 ± 0.036 |
Met |
Asn |
Gln |
Pro |
Arg |
Ser |
Thr |
Val |
Trp |
Tyr |
|---|---|---|---|---|---|---|---|---|---|
2.517 ± 0.017 | 3.002 ± 0.017 |
4.864 ± 0.019 | 3.232 ± 0.021 |
6.592 ± 0.031 | 5.963 ± 0.025 |
5.379 ± 0.03 | 7.164 ± 0.022 |
1.319 ± 0.013 | 2.379 ± 0.015 |
Most of the basic statistics you can see at this page can be downloaded from this CSV file
See this proteome in:

Proteome-pI is available under Creative Commons Attribution-NoDerivs license, for more details see here
| Reference: Kozlowski LP. Proteome-pI 2.0: Proteome Isoelectric Point Database Update. Nucleic Acids Res. 2021, doi: 10.1093/nar/gkab944 | Contact: Lukasz P. Kozlowski |