Opuntia virus X
Taxonomy: Viruses; Riboviria; Orthornavirae; Kitrinoviricota; Alsuviricetes; Tymovirales; Alphaflexiviridae; Potexvirus
Average proteome isoelectric point is 6.81
Get precalculated fractions of proteins
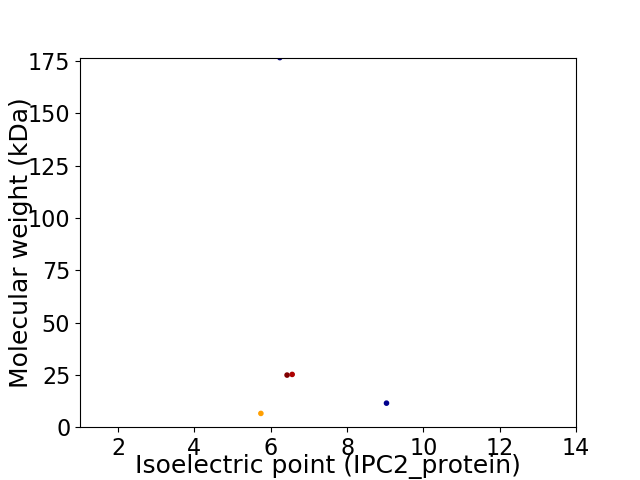
Virtual 2D-PAGE plot for 5 proteins (isoelectric point calculated using IPC2_protein)
Get csv file with sequences according to given criteria:
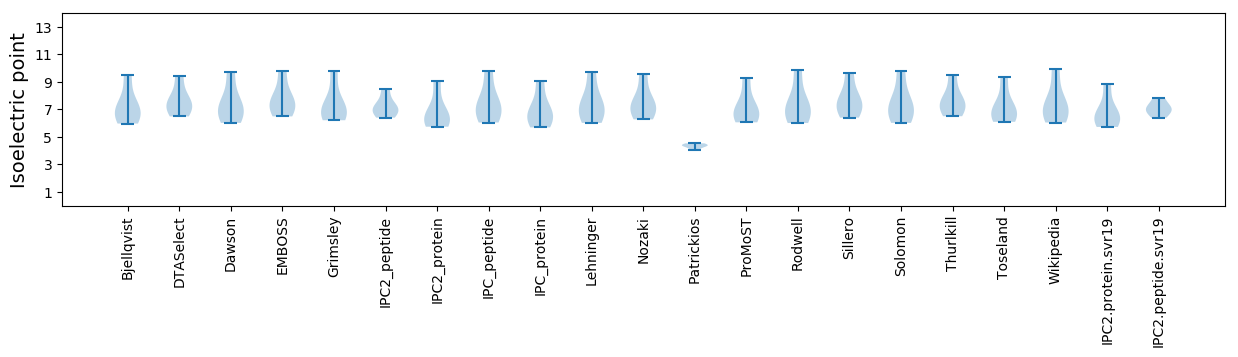
* You can choose from 21 different methods for calculating isoelectric point
Summary statistics related to proteome-wise predictions
Protein with the lowest isoelectric point:
>tr|Q6UNH9|Q6UNH9_9VIRU Triple gene block protein 2 OS=Opuntia virus X OX=253702 PE=4 SV=1
MM1 pKa = 7.44LVLSFLVGAALGLALLAALHH21 pKa = 5.78TGEE24 pKa = 5.3NKK26 pKa = 10.39GCLIQFNGHH35 pKa = 4.64STIVSNCQDD44 pKa = 3.69VKK46 pKa = 11.47DD47 pKa = 3.78LAAVINAINDD57 pKa = 3.69RR58 pKa = 11.84LSFSNN63 pKa = 3.76
MM1 pKa = 7.44LVLSFLVGAALGLALLAALHH21 pKa = 5.78TGEE24 pKa = 5.3NKK26 pKa = 10.39GCLIQFNGHH35 pKa = 4.64STIVSNCQDD44 pKa = 3.69VKK46 pKa = 11.47DD47 pKa = 3.78LAAVINAINDD57 pKa = 3.69RR58 pKa = 11.84LSFSNN63 pKa = 3.76
Molecular weight: 6.58 kDa
Isoelectric point according different methods:
Protein with the highest isoelectric point:
>tr|Q6UNI0|Q6UNI0_9VIRU Triple gene block protein 1 OS=Opuntia virus X OX=253702 PE=4 SV=1
MM1 pKa = 7.51SGHH4 pKa = 7.14PLRR7 pKa = 11.84LTPPPDD13 pKa = 3.18YY14 pKa = 11.02SKK16 pKa = 11.38AVTSLTIGLTLVLAVYY32 pKa = 10.22AVTRR36 pKa = 11.84STLPTVGDD44 pKa = 3.93SSHH47 pKa = 6.53SLPHH51 pKa = 6.08GGFYY55 pKa = 10.49KK56 pKa = 10.84DD57 pKa = 3.12GTKK60 pKa = 8.77TVKK63 pKa = 10.78YY64 pKa = 10.13LGPSDD69 pKa = 3.78NHH71 pKa = 6.6SKK73 pKa = 10.62HH74 pKa = 6.02IPLLAVLVIIALIYY88 pKa = 10.62ASSFLSSGRR97 pKa = 11.84RR98 pKa = 11.84TGTCSSCGTAHH109 pKa = 7.32GG110 pKa = 4.16
MM1 pKa = 7.51SGHH4 pKa = 7.14PLRR7 pKa = 11.84LTPPPDD13 pKa = 3.18YY14 pKa = 11.02SKK16 pKa = 11.38AVTSLTIGLTLVLAVYY32 pKa = 10.22AVTRR36 pKa = 11.84STLPTVGDD44 pKa = 3.93SSHH47 pKa = 6.53SLPHH51 pKa = 6.08GGFYY55 pKa = 10.49KK56 pKa = 10.84DD57 pKa = 3.12GTKK60 pKa = 8.77TVKK63 pKa = 10.78YY64 pKa = 10.13LGPSDD69 pKa = 3.78NHH71 pKa = 6.6SKK73 pKa = 10.62HH74 pKa = 6.02IPLLAVLVIIALIYY88 pKa = 10.62ASSFLSSGRR97 pKa = 11.84RR98 pKa = 11.84TGTCSSCGTAHH109 pKa = 7.32GG110 pKa = 4.16
Molecular weight: 11.49 kDa
Isoelectric point according different methods:
Peptides (in silico digests for buttom-up proteomics)
Below you can find in silico digests of the whole proteome with Trypsin, Chymotrypsin, Trypsin+LysC, LysN, ArgC proteases suitable for different mass spec machines.| Try ESI |
 |
|---|
| ChTry ESI |
|
|---|
| ArgC ESI |
|
|---|
| LysN ESI |
|
|---|
| TryLysC ESI |
|
|---|
| Try MALDI |
|
|---|
| ChTry MALDI |
|
|---|
| ArgC MALDI |
|
|---|
| LysN MALDI |
|
|---|
| TryLysC MALDI |
|
|---|
| Try LTQ |
|
|---|
| ChTry LTQ |
|
|---|
| ArgC LTQ |
|
|---|
| LysN LTQ |
|
|---|
| TryLysC LTQ |
|
|---|
| Try MSlow |
|
|---|
| ChTry MSlow |
|
|---|
| ArgC MSlow |
|
|---|
| LysN MSlow |
|
|---|
| TryLysC MSlow |
|
|---|
| Try MShigh |
|
|---|
| ChTry MShigh |
|
|---|
| ArgC MShigh |
|
|---|
| LysN MShigh |
|
|---|
| TryLysC MShigh |
|
|---|
General Statistics
Number of major isoforms |
Number of additional isoforms |
Number of all proteins |
Number of amino acids |
Min. Seq. Length |
Max. Seq. Length |
Avg. Seq. Length |
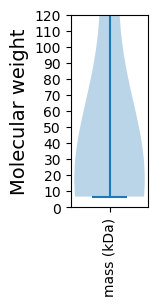
Avg. Mol. Weight |
|---|---|---|---|---|---|---|---|
0 |
2186 |
63 |
1555 |
437.2 |
48.96 |
Amino acid frequency
Ala |
Cys |
Asp |
Glu |
Phe |
Gly |
His |
Ile |
Lys |
Leu |
|---|---|---|---|---|---|---|---|---|---|
8.143 ± 1.03 | 1.51 ± 0.42 |
4.895 ± 0.586 | 5.672 ± 1.236 |
4.941 ± 0.501 | 4.986 ± 0.995 |
3.339 ± 0.519 | 5.672 ± 0.381 |
6.496 ± 1.235 | 9.515 ± 1.147 |
Met |
Asn |
Gln |
Pro |
Arg |
Ser |
Thr |
Val |
Trp |
Tyr |
|---|---|---|---|---|---|---|---|---|---|
2.013 ± 0.405 | 4.209 ± 1.048 |
6.176 ± 0.695 | 4.895 ± 1.061 |
3.843 ± 0.314 | 7.182 ± 1.575 |
7.274 ± 0.715 | 5.078 ± 0.618 |
1.281 ± 0.433 | 2.882 ± 0.633 |
Most of the basic statistics you can see at this page can be downloaded from this CSV file
See this proteome in:

Proteome-pI is available under Creative Commons Attribution-NoDerivs license, for more details see here
| Reference: Kozlowski LP. Proteome-pI 2.0: Proteome Isoelectric Point Database Update. Nucleic Acids Res. 2021, doi: 10.1093/nar/gkab944 | Contact: Lukasz P. Kozlowski |