Enterococcus phage vB_EfaS_HEf13
Taxonomy: Viruses; Duplodnaviria; Heunggongvirae; Uroviricota; Caudoviricetes; Caudovirales; Siphoviridae; Saphexavirus; unclassified Saphexavirus
Average proteome isoelectric point is 5.78
Get precalculated fractions of proteins
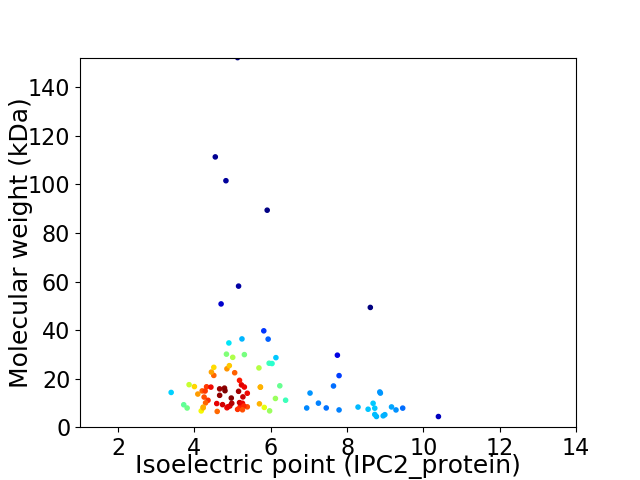
Virtual 2D-PAGE plot for 95 proteins (isoelectric point calculated using IPC2_protein)
Get csv file with sequences according to given criteria:
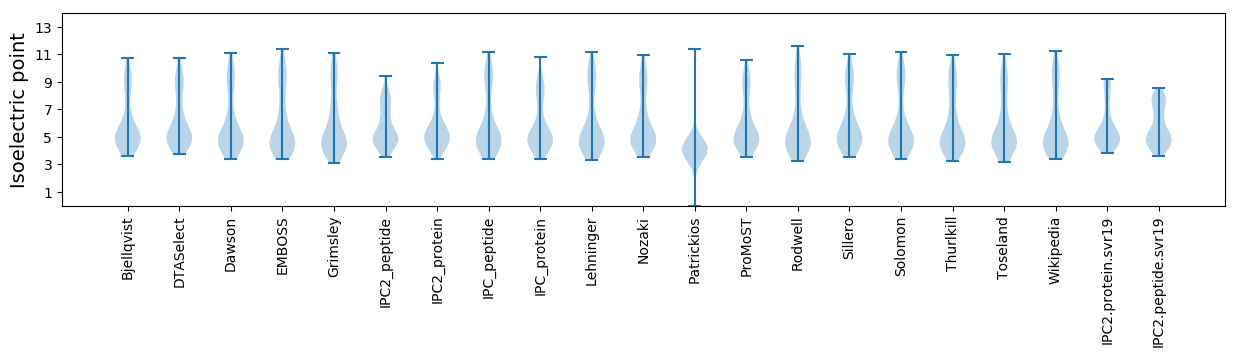
* You can choose from 21 different methods for calculating isoelectric point
Summary statistics related to proteome-wise predictions
Protein with the lowest isoelectric point:
>tr|A0A510C2N0|A0A510C2N0_9CAUD Uncharacterized protein OS=Enterococcus phage vB_EfaS_HEf13 OX=2283014 GN=vBEfaSHEf13_035 PE=4 SV=1
MM1 pKa = 7.91IEE3 pKa = 4.22LFKK6 pKa = 11.43EE7 pKa = 3.93NLTLDD12 pKa = 3.65EE13 pKa = 5.02MSEE16 pKa = 3.58IWYY19 pKa = 9.15GWDD22 pKa = 4.23NEE24 pKa = 3.9GLLYY28 pKa = 10.6GWEE31 pKa = 3.94NGEE34 pKa = 4.07AGEE37 pKa = 4.79AYY39 pKa = 10.4ALLYY43 pKa = 10.29EE44 pKa = 4.64NGYY47 pKa = 11.14NMDD50 pKa = 4.3SIKK53 pKa = 10.61VLHH56 pKa = 6.42EE57 pKa = 4.26AFDD60 pKa = 4.49TIGEE64 pKa = 4.39LIGAII69 pKa = 3.92
MM1 pKa = 7.91IEE3 pKa = 4.22LFKK6 pKa = 11.43EE7 pKa = 3.93NLTLDD12 pKa = 3.65EE13 pKa = 5.02MSEE16 pKa = 3.58IWYY19 pKa = 9.15GWDD22 pKa = 4.23NEE24 pKa = 3.9GLLYY28 pKa = 10.6GWEE31 pKa = 3.94NGEE34 pKa = 4.07AGEE37 pKa = 4.79AYY39 pKa = 10.4ALLYY43 pKa = 10.29EE44 pKa = 4.64NGYY47 pKa = 11.14NMDD50 pKa = 4.3SIKK53 pKa = 10.61VLHH56 pKa = 6.42EE57 pKa = 4.26AFDD60 pKa = 4.49TIGEE64 pKa = 4.39LIGAII69 pKa = 3.92
Molecular weight: 7.91 kDa
Isoelectric point according different methods:
Protein with the highest isoelectric point:
>tr|A0A510C2U9|A0A510C2U9_9CAUD Terminase large subunit OS=Enterococcus phage vB_EfaS_HEf13 OX=2283014 GN=vBEfaSHEf13_069 PE=4 SV=1
MM1 pKa = 7.86PYY3 pKa = 10.24KK4 pKa = 10.78GLFKK8 pKa = 10.62HH9 pKa = 6.77FYY11 pKa = 10.4AFLKK15 pKa = 10.87AFLALFTRR23 pKa = 11.84LFARR27 pKa = 11.84SLLKK31 pKa = 10.54SIKK34 pKa = 9.53TLLL37 pKa = 3.77
MM1 pKa = 7.86PYY3 pKa = 10.24KK4 pKa = 10.78GLFKK8 pKa = 10.62HH9 pKa = 6.77FYY11 pKa = 10.4AFLKK15 pKa = 10.87AFLALFTRR23 pKa = 11.84LFARR27 pKa = 11.84SLLKK31 pKa = 10.54SIKK34 pKa = 9.53TLLL37 pKa = 3.77
Molecular weight: 4.4 kDa
Isoelectric point according different methods:
Peptides (in silico digests for buttom-up proteomics)
Below you can find in silico digests of the whole proteome with Trypsin, Chymotrypsin, Trypsin+LysC, LysN, ArgC proteases suitable for different mass spec machines.| Try ESI |
 |
|---|
| ChTry ESI |
|
|---|
| ArgC ESI |
|
|---|
| LysN ESI |
|
|---|
| TryLysC ESI |
|
|---|
| Try MALDI |
|
|---|
| ChTry MALDI |
|
|---|
| ArgC MALDI |
|
|---|
| LysN MALDI |
|
|---|
| TryLysC MALDI |
|
|---|
| Try LTQ |
|
|---|
| ChTry LTQ |
|
|---|
| ArgC LTQ |
|
|---|
| LysN LTQ |
|
|---|
| TryLysC LTQ |
|
|---|
| Try MSlow |
|
|---|
| ChTry MSlow |
|
|---|
| ArgC MSlow |
|
|---|
| LysN MSlow |
|
|---|
| TryLysC MSlow |
|
|---|
| Try MShigh |
|
|---|
| ChTry MShigh |
|
|---|
| ArgC MShigh |
|
|---|
| LysN MShigh |
|
|---|
| TryLysC MShigh |
|
|---|
General Statistics
Number of major isoforms |
Number of additional isoforms |
Number of all proteins |
Number of amino acids |
Min. Seq. Length |
Max. Seq. Length |
Avg. Seq. Length |
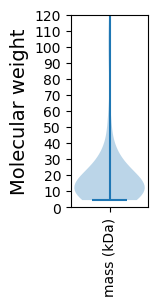
Avg. Mol. Weight |
|---|---|---|---|---|---|---|---|
0 |
16763 |
37 |
1330 |
176.5 |
20.03 |
Amino acid frequency
Ala |
Cys |
Asp |
Glu |
Phe |
Gly |
His |
Ile |
Lys |
Leu |
|---|---|---|---|---|---|---|---|---|---|
7.242 ± 0.505 | 0.698 ± 0.089 |
6.312 ± 0.217 | 9.181 ± 0.414 |
4.259 ± 0.237 | 6.091 ± 0.369 |
1.456 ± 0.116 | 6.264 ± 0.229 |
7.779 ± 0.301 | 8.596 ± 0.377 |
Met |
Asn |
Gln |
Pro |
Arg |
Ser |
Thr |
Val |
Trp |
Tyr |
|---|---|---|---|---|---|---|---|---|---|
2.684 ± 0.164 | 5.023 ± 0.187 |
2.959 ± 0.227 | 3.496 ± 0.286 |
4.027 ± 0.217 | 5.906 ± 0.222 |
6.001 ± 0.307 | 6.485 ± 0.23 |
1.312 ± 0.117 | 4.23 ± 0.245 |
Most of the basic statistics you can see at this page can be downloaded from this CSV file
See this proteome in:

Proteome-pI is available under Creative Commons Attribution-NoDerivs license, for more details see here
| Reference: Kozlowski LP. Proteome-pI 2.0: Proteome Isoelectric Point Database Update. Nucleic Acids Res. 2021, doi: 10.1093/nar/gkab944 | Contact: Lukasz P. Kozlowski |