Ralstonia phage RSL2
Taxonomy: Viruses; Duplodnaviria; Heunggongvirae; Uroviricota; Caudoviricetes; Caudovirales; Myoviridae; Chiangmaivirus; Ralstonia virus RSL2
Average proteome isoelectric point is 6.0
Get precalculated fractions of proteins
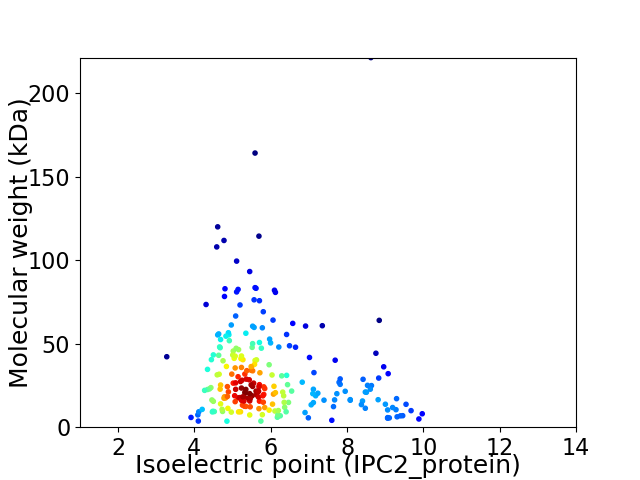
Virtual 2D-PAGE plot for 237 proteins (isoelectric point calculated using IPC2_protein)
Get csv file with sequences according to given criteria:
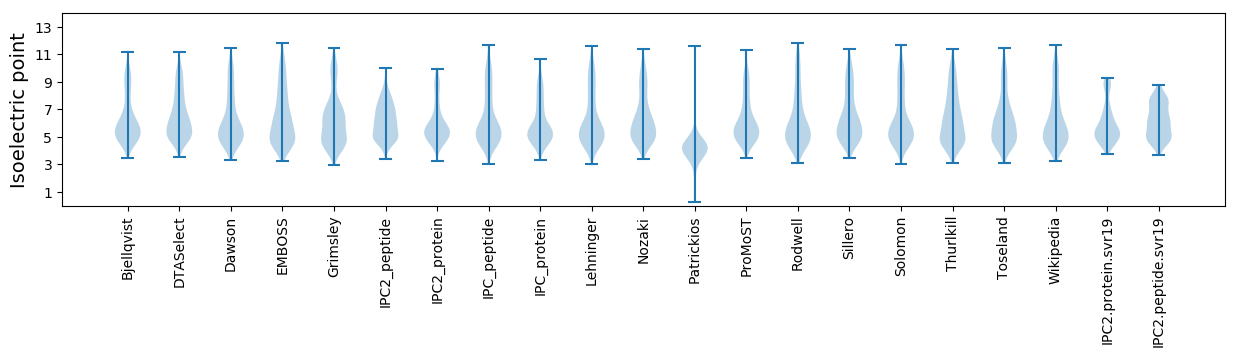
* You can choose from 21 different methods for calculating isoelectric point
Summary statistics related to proteome-wise predictions
Protein with the lowest isoelectric point:
>tr|A0A0A8JBF8|A0A0A8JBF8_9CAUD Uncharacterized protein OS=Ralstonia phage RSL2 OX=1585840 PE=4 SV=1
MM1 pKa = 7.47LVFLLVEE8 pKa = 4.31KK9 pKa = 10.85ADD11 pKa = 3.87DD12 pKa = 3.9AFDD15 pKa = 3.8YY16 pKa = 11.44VFGQCCEE23 pKa = 4.39GFDD26 pKa = 3.86SQHH29 pKa = 6.68LGFEE33 pKa = 4.41FVEE36 pKa = 4.31NFVDD40 pKa = 4.21DD41 pKa = 3.96AHH43 pKa = 6.96DD44 pKa = 3.92FSLKK48 pKa = 10.64GVFF51 pKa = 4.14
MM1 pKa = 7.47LVFLLVEE8 pKa = 4.31KK9 pKa = 10.85ADD11 pKa = 3.87DD12 pKa = 3.9AFDD15 pKa = 3.8YY16 pKa = 11.44VFGQCCEE23 pKa = 4.39GFDD26 pKa = 3.86SQHH29 pKa = 6.68LGFEE33 pKa = 4.41FVEE36 pKa = 4.31NFVDD40 pKa = 4.21DD41 pKa = 3.96AHH43 pKa = 6.96DD44 pKa = 3.92FSLKK48 pKa = 10.64GVFF51 pKa = 4.14
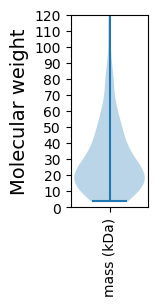
Molecular weight: 5.84 kDa
Isoelectric point according different methods:
Protein with the highest isoelectric point:
>tr|A0A0A8J9C6|A0A0A8J9C6_9CAUD Uncharacterized protein OS=Ralstonia phage RSL2 OX=1585840 PE=4 SV=2
MM1 pKa = 7.36QSAPQTNMAILANGAEE17 pKa = 4.43LTRR20 pKa = 11.84NTVASMMTNEE30 pKa = 3.8NVRR33 pKa = 11.84NFFGQPAARR42 pKa = 11.84DD43 pKa = 3.29TVYY46 pKa = 10.49RR47 pKa = 11.84VFMMKK52 pKa = 8.65VHH54 pKa = 6.65KK55 pKa = 10.15KK56 pKa = 10.88LEE58 pKa = 4.22GALRR62 pKa = 11.84NMPSGQFNKK71 pKa = 9.99SVRR74 pKa = 11.84TGEE77 pKa = 4.24HH78 pKa = 4.72QSGAVNPNVIAKK90 pKa = 9.77
MM1 pKa = 7.36QSAPQTNMAILANGAEE17 pKa = 4.43LTRR20 pKa = 11.84NTVASMMTNEE30 pKa = 3.8NVRR33 pKa = 11.84NFFGQPAARR42 pKa = 11.84DD43 pKa = 3.29TVYY46 pKa = 10.49RR47 pKa = 11.84VFMMKK52 pKa = 8.65VHH54 pKa = 6.65KK55 pKa = 10.15KK56 pKa = 10.88LEE58 pKa = 4.22GALRR62 pKa = 11.84NMPSGQFNKK71 pKa = 9.99SVRR74 pKa = 11.84TGEE77 pKa = 4.24HH78 pKa = 4.72QSGAVNPNVIAKK90 pKa = 9.77
Molecular weight: 9.91 kDa
Isoelectric point according different methods:
Peptides (in silico digests for buttom-up proteomics)
Below you can find in silico digests of the whole proteome with Trypsin, Chymotrypsin, Trypsin+LysC, LysN, ArgC proteases suitable for different mass spec machines.| Try ESI |
 |
|---|
| ChTry ESI |
|
|---|
| ArgC ESI |
|
|---|
| LysN ESI |
|
|---|
| TryLysC ESI |
|
|---|
| Try MALDI |
|
|---|
| ChTry MALDI |
|
|---|
| ArgC MALDI |
|
|---|
| LysN MALDI |
|
|---|
| TryLysC MALDI |
|
|---|
| Try LTQ |
|
|---|
| ChTry LTQ |
|
|---|
| ArgC LTQ |
|
|---|
| LysN LTQ |
|
|---|
| TryLysC LTQ |
|
|---|
| Try MSlow |
|
|---|
| ChTry MSlow |
|
|---|
| ArgC MSlow |
|
|---|
| LysN MSlow |
|
|---|
| TryLysC MSlow |
|
|---|
| Try MShigh |
|
|---|
| ChTry MShigh |
|
|---|
| ArgC MShigh |
|
|---|
| LysN MShigh |
|
|---|
| TryLysC MShigh |
|
|---|
General Statistics
Number of major isoforms |
Number of additional isoforms |
Number of all proteins |
Number of amino acids |
Min. Seq. Length |
Max. Seq. Length |
Avg. Seq. Length |
Avg. Mol. Weight |
|---|---|---|---|---|---|---|---|
0 |
68019 |
31 |
2039 |
287.0 |
32.34 |
Amino acid frequency
Ala |
Cys |
Asp |
Glu |
Phe |
Gly |
His |
Ile |
Lys |
Leu |
|---|---|---|---|---|---|---|---|---|---|
7.857 ± 0.303 | 0.844 ± 0.052 |
6.717 ± 0.136 | 6.263 ± 0.204 |
4.408 ± 0.105 | 6.511 ± 0.229 |
2.077 ± 0.087 | 5.791 ± 0.126 |
6.073 ± 0.227 | 8.149 ± 0.134 |
Met |
Asn |
Gln |
Pro |
Arg |
Ser |
Thr |
Val |
Trp |
Tyr |
|---|---|---|---|---|---|---|---|---|---|
3.139 ± 0.093 | 5.046 ± 0.124 |
4.336 ± 0.107 | 4.283 ± 0.129 |
4.938 ± 0.186 | 5.856 ± 0.143 |
5.957 ± 0.192 | 6.5 ± 0.124 |
1.285 ± 0.06 | 3.971 ± 0.126 |
Most of the basic statistics you can see at this page can be downloaded from this CSV file
See this proteome in:

Proteome-pI is available under Creative Commons Attribution-NoDerivs license, for more details see here
| Reference: Kozlowski LP. Proteome-pI 2.0: Proteome Isoelectric Point Database Update. Nucleic Acids Res. 2021, doi: 10.1093/nar/gkab944 | Contact: Lukasz P. Kozlowski |