Escherichia phage SSL-2009a
Taxonomy: Viruses; Duplodnaviria; Heunggongvirae; Uroviricota; Caudoviricetes; Caudovirales; Siphoviridae; Dhillonvirus; Escherichia virus SSL2009a
Average proteome isoelectric point is 6.94
Get precalculated fractions of proteins
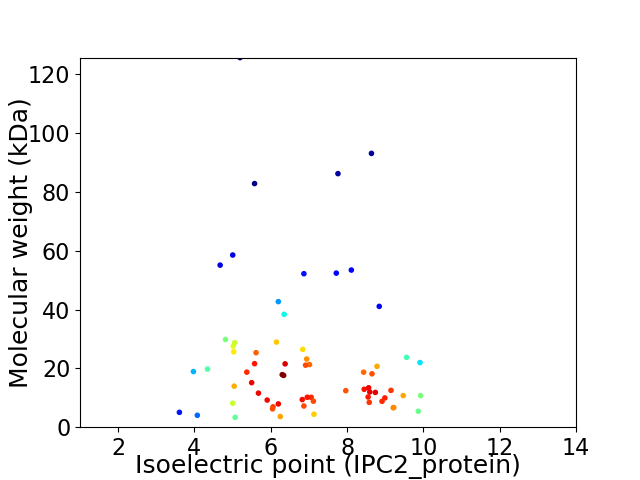
Virtual 2D-PAGE plot for 67 proteins (isoelectric point calculated using IPC2_protein)
Get csv file with sequences according to given criteria:
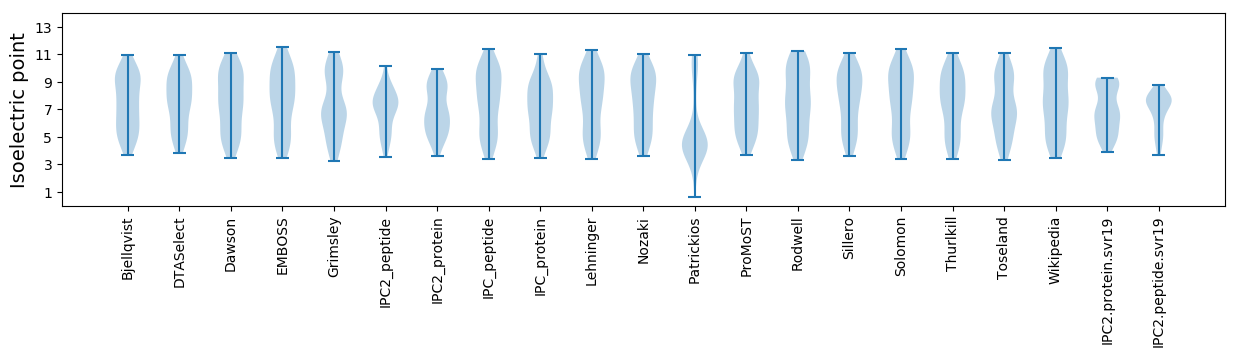
* You can choose from 21 different methods for calculating isoelectric point
Summary statistics related to proteome-wise predictions
Protein with the lowest isoelectric point:
>tr|T2DRR6|T2DRR6_9CAUD Putative holin-like class I protein OS=Escherichia phage SSL-2009a OX=2681619 PE=4 SV=1
MM1 pKa = 7.32TPALMAGFSQKK12 pKa = 10.29FISVDD17 pKa = 3.0ACIADD22 pKa = 3.62YY23 pKa = 11.33EE24 pKa = 4.26MDD26 pKa = 5.54GIATVCDD33 pKa = 4.37GDD35 pKa = 3.97TKK37 pKa = 10.66TADD40 pKa = 3.69EE41 pKa = 4.54IEE43 pKa = 4.33EE44 pKa = 4.44TEE46 pKa = 4.01QQ47 pKa = 3.81
MM1 pKa = 7.32TPALMAGFSQKK12 pKa = 10.29FISVDD17 pKa = 3.0ACIADD22 pKa = 3.62YY23 pKa = 11.33EE24 pKa = 4.26MDD26 pKa = 5.54GIATVCDD33 pKa = 4.37GDD35 pKa = 3.97TKK37 pKa = 10.66TADD40 pKa = 3.69EE41 pKa = 4.54IEE43 pKa = 4.33EE44 pKa = 4.44TEE46 pKa = 4.01QQ47 pKa = 3.81
Molecular weight: 5.06 kDa
Isoelectric point according different methods:
Protein with the highest isoelectric point:
>tr|T2DR30|T2DR30_9CAUD BIG2 domain-containing protein OS=Escherichia phage SSL-2009a OX=2681619 PE=4 SV=1
MM1 pKa = 7.46SATTRR6 pKa = 11.84DD7 pKa = 3.61MLQHH11 pKa = 5.81NRR13 pKa = 11.84FEE15 pKa = 4.13IGGRR19 pKa = 11.84VFRR22 pKa = 11.84NYY24 pKa = 9.44FVARR28 pKa = 11.84AWARR32 pKa = 11.84HH33 pKa = 4.64IGKK36 pKa = 9.03PEE38 pKa = 3.66GAIRR42 pKa = 11.84CYY44 pKa = 10.59TMM46 pKa = 4.87
MM1 pKa = 7.46SATTRR6 pKa = 11.84DD7 pKa = 3.61MLQHH11 pKa = 5.81NRR13 pKa = 11.84FEE15 pKa = 4.13IGGRR19 pKa = 11.84VFRR22 pKa = 11.84NYY24 pKa = 9.44FVARR28 pKa = 11.84AWARR32 pKa = 11.84HH33 pKa = 4.64IGKK36 pKa = 9.03PEE38 pKa = 3.66GAIRR42 pKa = 11.84CYY44 pKa = 10.59TMM46 pKa = 4.87
Molecular weight: 5.42 kDa
Isoelectric point according different methods:
Peptides (in silico digests for buttom-up proteomics)
Below you can find in silico digests of the whole proteome with Trypsin, Chymotrypsin, Trypsin+LysC, LysN, ArgC proteases suitable for different mass spec machines.| Try ESI |
 |
|---|
| ChTry ESI |
|
|---|
| ArgC ESI |
|
|---|
| LysN ESI |
|
|---|
| TryLysC ESI |
|
|---|
| Try MALDI |
|
|---|
| ChTry MALDI |
|
|---|
| ArgC MALDI |
|
|---|
| LysN MALDI |
|
|---|
| TryLysC MALDI |
|
|---|
| Try LTQ |
|
|---|
| ChTry LTQ |
|
|---|
| ArgC LTQ |
|
|---|
| LysN LTQ |
|
|---|
| TryLysC LTQ |
|
|---|
| Try MSlow |
|
|---|
| ChTry MSlow |
|
|---|
| ArgC MSlow |
|
|---|
| LysN MSlow |
|
|---|
| TryLysC MSlow |
|
|---|
| Try MShigh |
|
|---|
| ChTry MShigh |
|
|---|
| ArgC MShigh |
|
|---|
| LysN MShigh |
|
|---|
| TryLysC MShigh |
|
|---|
General Statistics
Number of major isoforms |
Number of additional isoforms |
Number of all proteins |
Number of amino acids |
Min. Seq. Length |
Max. Seq. Length |
Avg. Seq. Length |
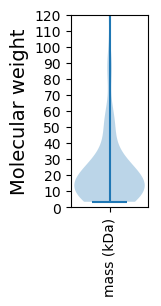
Avg. Mol. Weight |
|---|---|---|---|---|---|---|---|
0 |
14246 |
29 |
1139 |
212.6 |
23.55 |
Amino acid frequency
Ala |
Cys |
Asp |
Glu |
Phe |
Gly |
His |
Ile |
Lys |
Leu |
|---|---|---|---|---|---|---|---|---|---|
10.663 ± 0.519 | 1.186 ± 0.162 |
6.402 ± 0.282 | 6.037 ± 0.284 |
3.713 ± 0.184 | 7.764 ± 0.274 |
1.832 ± 0.18 | 5.398 ± 0.269 |
6.128 ± 0.371 | 7.378 ± 0.238 |
Met |
Asn |
Gln |
Pro |
Arg |
Ser |
Thr |
Val |
Trp |
Tyr |
|---|---|---|---|---|---|---|---|---|---|
2.815 ± 0.184 | 4.219 ± 0.222 |
3.861 ± 0.214 | 3.854 ± 0.267 |
6.114 ± 0.245 | 4.668 ± 0.218 |
6.198 ± 0.253 | 7.272 ± 0.273 |
1.614 ± 0.148 | 2.885 ± 0.199 |
Most of the basic statistics you can see at this page can be downloaded from this CSV file
See this proteome in:

Proteome-pI is available under Creative Commons Attribution-NoDerivs license, for more details see here
| Reference: Kozlowski LP. Proteome-pI 2.0: Proteome Isoelectric Point Database Update. Nucleic Acids Res. 2021, doi: 10.1093/nar/gkab944 | Contact: Lukasz P. Kozlowski |