Streptomyces silvensis
Taxonomy: cellular organisms; Bacteria; Terrabacteria group; Actinobacteria; Actinomycetia; Streptomycetales; Streptomycetaceae; Streptomyces
Average proteome isoelectric point is 6.46
Get precalculated fractions of proteins
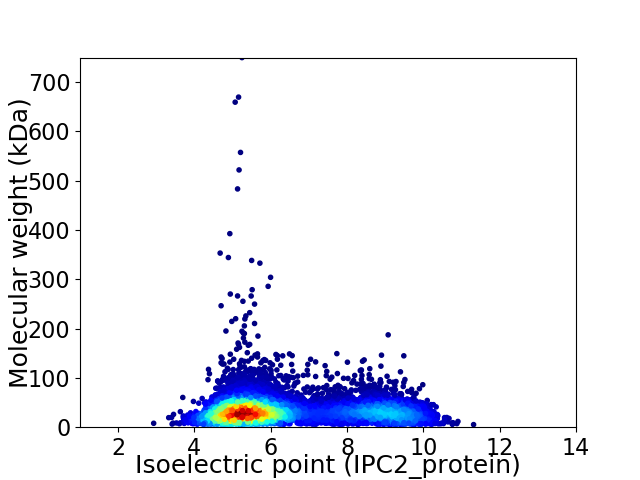
Virtual 2D-PAGE plot for 7592 proteins (isoelectric point calculated using IPC2_protein)
Get csv file with sequences according to given criteria:
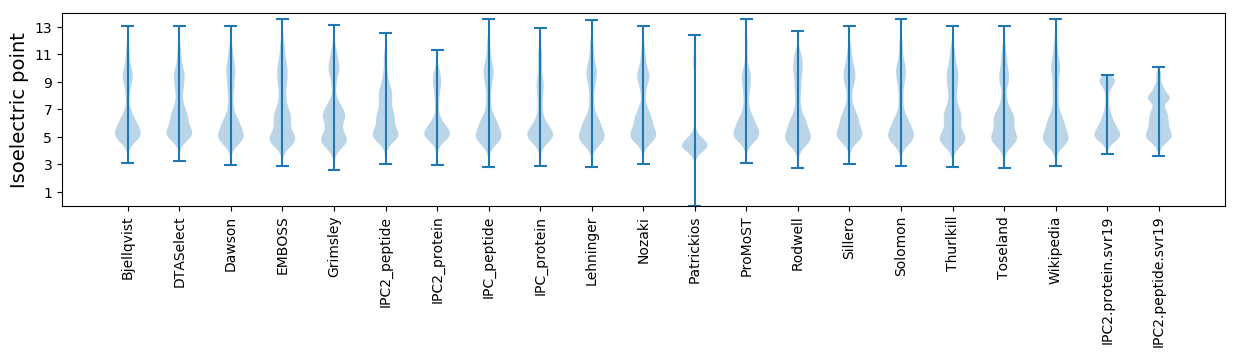
* You can choose from 21 different methods for calculating isoelectric point
Summary statistics related to proteome-wise predictions
Protein with the lowest isoelectric point:
>tr|A0A0W7X5A8|A0A0W7X5A8_9ACTN Dihydrodipicolinate synthase family protein OS=Streptomyces silvensis OX=1765722 GN=AT728_20610 PE=3 SV=1
MM1 pKa = 7.68AATTDD6 pKa = 3.5APANPFDD13 pKa = 5.48ADD15 pKa = 4.09TPSSTFLVLVNDD27 pKa = 4.39RR28 pKa = 11.84GQYY31 pKa = 9.61SLWPLFADD39 pKa = 4.27VPEE42 pKa = 4.7GWTTVYY48 pKa = 10.59GPCSRR53 pKa = 11.84TQALTWVTTCAVDD66 pKa = 4.46PGALTPGALTRR77 pKa = 4.25
MM1 pKa = 7.68AATTDD6 pKa = 3.5APANPFDD13 pKa = 5.48ADD15 pKa = 4.09TPSSTFLVLVNDD27 pKa = 4.39RR28 pKa = 11.84GQYY31 pKa = 9.61SLWPLFADD39 pKa = 4.27VPEE42 pKa = 4.7GWTTVYY48 pKa = 10.59GPCSRR53 pKa = 11.84TQALTWVTTCAVDD66 pKa = 4.46PGALTPGALTRR77 pKa = 4.25
Molecular weight: 8.18 kDa
Isoelectric point according different methods:
Protein with the highest isoelectric point:
>tr|A0A0W7WZ91|A0A0W7WZ91_9ACTN 2-oxoisovalerate dehydrogenase OS=Streptomyces silvensis OX=1765722 GN=AT728_14355 PE=4 SV=1
MM1 pKa = 7.69SKK3 pKa = 9.0RR4 pKa = 11.84TFQPNNRR11 pKa = 11.84RR12 pKa = 11.84RR13 pKa = 11.84AKK15 pKa = 8.7THH17 pKa = 5.15GFRR20 pKa = 11.84LRR22 pKa = 11.84MRR24 pKa = 11.84TRR26 pKa = 11.84AGRR29 pKa = 11.84AVLASRR35 pKa = 11.84RR36 pKa = 11.84SKK38 pKa = 10.74GRR40 pKa = 11.84ARR42 pKa = 11.84LSAA45 pKa = 3.91
MM1 pKa = 7.69SKK3 pKa = 9.0RR4 pKa = 11.84TFQPNNRR11 pKa = 11.84RR12 pKa = 11.84RR13 pKa = 11.84AKK15 pKa = 8.7THH17 pKa = 5.15GFRR20 pKa = 11.84LRR22 pKa = 11.84MRR24 pKa = 11.84TRR26 pKa = 11.84AGRR29 pKa = 11.84AVLASRR35 pKa = 11.84RR36 pKa = 11.84SKK38 pKa = 10.74GRR40 pKa = 11.84ARR42 pKa = 11.84LSAA45 pKa = 3.91
Molecular weight: 5.27 kDa
Isoelectric point according different methods:
Peptides (in silico digests for buttom-up proteomics)
Below you can find in silico digests of the whole proteome with Trypsin, Chymotrypsin, Trypsin+LysC, LysN, ArgC proteases suitable for different mass spec machines.| Try ESI |
 |
|---|
| ChTry ESI |
|
|---|
| ArgC ESI |
|
|---|
| LysN ESI |
|
|---|
| TryLysC ESI |
|
|---|
| Try MALDI |
|
|---|
| ChTry MALDI |
|
|---|
| ArgC MALDI |
|
|---|
| LysN MALDI |
|
|---|
| TryLysC MALDI |
|
|---|
| Try LTQ |
|
|---|
| ChTry LTQ |
|
|---|
| ArgC LTQ |
|
|---|
| LysN LTQ |
|
|---|
| TryLysC LTQ |
|
|---|
| Try MSlow |
|
|---|
| ChTry MSlow |
|
|---|
| ArgC MSlow |
|
|---|
| LysN MSlow |
|
|---|
| TryLysC MSlow |
|
|---|
| Try MShigh |
|
|---|
| ChTry MShigh |
|
|---|
| ArgC MShigh |
|
|---|
| LysN MShigh |
|
|---|
| TryLysC MShigh |
|
|---|
General Statistics
Number of major isoforms |
Number of additional isoforms |
Number of all proteins |
Number of amino acids |
Min. Seq. Length |
Max. Seq. Length |
Avg. Seq. Length |
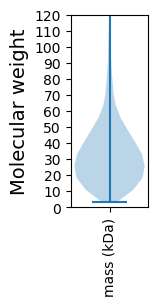
Avg. Mol. Weight |
|---|---|---|---|---|---|---|---|
0 |
2528181 |
29 |
7065 |
333.0 |
35.59 |
Amino acid frequency
Ala |
Cys |
Asp |
Glu |
Phe |
Gly |
His |
Ile |
Lys |
Leu |
|---|---|---|---|---|---|---|---|---|---|
13.956 ± 0.055 | 0.804 ± 0.009 |
6.211 ± 0.022 | 5.595 ± 0.029 |
2.676 ± 0.015 | 9.638 ± 0.031 |
2.423 ± 0.016 | 2.87 ± 0.021 |
2.205 ± 0.031 | 10.204 ± 0.04 |
Met |
Asn |
Gln |
Pro |
Arg |
Ser |
Thr |
Val |
Trp |
Tyr |
|---|---|---|---|---|---|---|---|---|---|
1.658 ± 0.014 | 1.65 ± 0.017 |
6.166 ± 0.025 | 2.687 ± 0.018 |
8.3 ± 0.031 | 4.905 ± 0.021 |
6.064 ± 0.023 | 8.457 ± 0.03 |
1.489 ± 0.011 | 2.035 ± 0.013 |
Most of the basic statistics you can see at this page can be downloaded from this CSV file
See this proteome in:

Proteome-pI is available under Creative Commons Attribution-NoDerivs license, for more details see here
| Reference: Kozlowski LP. Proteome-pI 2.0: Proteome Isoelectric Point Database Update. Nucleic Acids Res. 2021, doi: 10.1093/nar/gkab944 | Contact: Lukasz P. Kozlowski |