Microbacterium lacticum
Taxonomy: cellular organisms; Bacteria; Terrabacteria group; Actinobacteria
Average proteome isoelectric point is 6.17
Get precalculated fractions of proteins
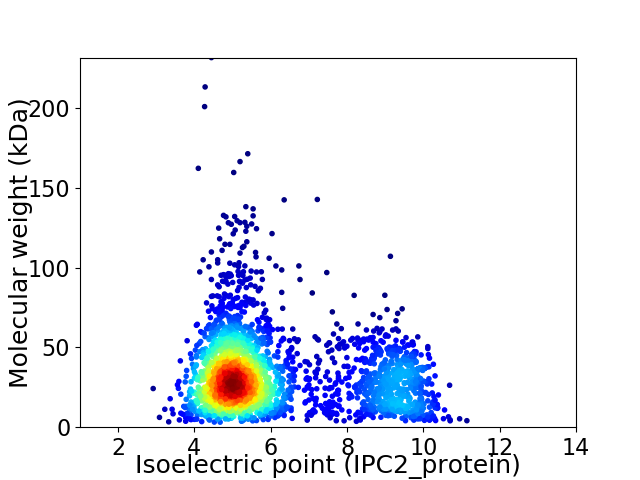
Virtual 2D-PAGE plot for 2765 proteins (isoelectric point calculated using IPC2_protein)
Get csv file with sequences according to given criteria:
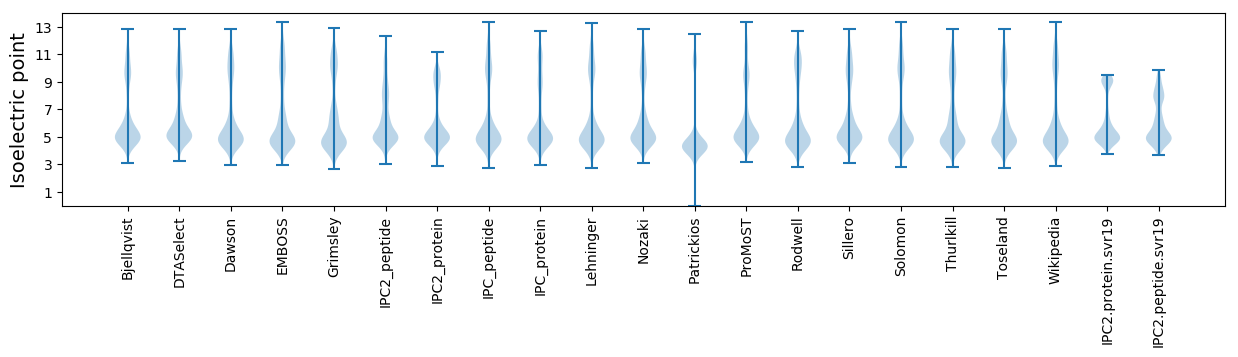
* You can choose from 21 different methods for calculating isoelectric point
Summary statistics related to proteome-wise predictions
Protein with the lowest isoelectric point:
>tr|A0A4Y3UNQ1|A0A4Y3UNQ1_9MICO Uncharacterized protein OS=Microbacterium lacticum OX=33885 GN=FHX68_0982 PE=4 SV=1
MM1 pKa = 6.61NTLRR5 pKa = 11.84RR6 pKa = 11.84ALTVVAALAVASLTLSGCLYY26 pKa = 10.79AAIPPEE32 pKa = 4.47TSATPAPSRR41 pKa = 11.84EE42 pKa = 4.0PDD44 pKa = 3.59LDD46 pKa = 3.66GAPAGFEE53 pKa = 3.89EE54 pKa = 6.39FYY56 pKa = 11.11GQTLSWTPCSGSDD69 pKa = 3.72AGSYY73 pKa = 10.96DD74 pKa = 3.99CTDD77 pKa = 2.82VAAPLDD83 pKa = 3.76WSDD86 pKa = 3.68PASGTIEE93 pKa = 3.81LAVIRR98 pKa = 11.84RR99 pKa = 11.84AATSGDD105 pKa = 3.46ALGSLLTNPGGPGASGYY122 pKa = 11.21DD123 pKa = 3.53LVADD127 pKa = 3.77SASFAVSEE135 pKa = 4.5PVLDD139 pKa = 4.62AYY141 pKa = 10.66DD142 pKa = 3.77VIGFDD147 pKa = 3.45PRR149 pKa = 11.84GVGRR153 pKa = 11.84STAVACLDD161 pKa = 3.68AAGMDD166 pKa = 3.32HH167 pKa = 6.78MLYY170 pKa = 10.34DD171 pKa = 3.93IPADD175 pKa = 3.6PRR177 pKa = 11.84GSQGWTDD184 pKa = 3.76EE185 pKa = 3.93LTQRR189 pKa = 11.84NTEE192 pKa = 3.94FVEE195 pKa = 4.35ACEE198 pKa = 4.23ANSAGILPFVTTDD211 pKa = 2.84NAARR215 pKa = 11.84DD216 pKa = 3.92MDD218 pKa = 4.55LLRR221 pKa = 11.84AVLGDD226 pKa = 3.2KK227 pKa = 9.37TLNYY231 pKa = 10.2LGYY234 pKa = 10.53SYY236 pKa = 10.59GTFLGATYY244 pKa = 10.93AKK246 pKa = 10.27LFPEE250 pKa = 4.08RR251 pKa = 11.84VGRR254 pKa = 11.84LVLDD258 pKa = 4.15GAIDD262 pKa = 4.02PSASGLDD269 pKa = 3.35VGTTQAIGFEE279 pKa = 4.41SALRR283 pKa = 11.84AYY285 pKa = 9.48MADD288 pKa = 3.54CLDD291 pKa = 3.67GRR293 pKa = 11.84GCPFTGTVDD302 pKa = 3.33QAMADD307 pKa = 3.86LGTLLASVDD316 pKa = 4.04AQPLPADD323 pKa = 4.33DD324 pKa = 4.74GRR326 pKa = 11.84MLGADD331 pKa = 3.45TLMTGIIAALYY342 pKa = 10.83AEE344 pKa = 5.31DD345 pKa = 3.39SWPYY349 pKa = 8.98LTQALSQALQGDD361 pKa = 4.23PTTALLLADD370 pKa = 5.19FYY372 pKa = 11.65NGRR375 pKa = 11.84NSDD378 pKa = 2.92GTYY381 pKa = 10.34QDD383 pKa = 3.48NSTEE387 pKa = 3.7AFRR390 pKa = 11.84AYY392 pKa = 11.17NCMDD396 pKa = 3.63YY397 pKa = 11.03PLDD400 pKa = 3.9TSQADD405 pKa = 3.28QDD407 pKa = 3.83AANALIAQKK416 pKa = 10.8APTIAPYY423 pKa = 8.53WQGVDD428 pKa = 3.44VCEE431 pKa = 4.11VWPYY435 pKa = 10.35PPTGVRR441 pKa = 11.84EE442 pKa = 4.28RR443 pKa = 11.84IAADD447 pKa = 3.63GAAPIVVVGTTNDD460 pKa = 3.63PATPYY465 pKa = 10.25AWSVSLAEE473 pKa = 4.11QLSSGVLVTRR483 pKa = 11.84EE484 pKa = 4.46GEE486 pKa = 4.08GHH488 pKa = 5.7TGYY491 pKa = 11.19NKK493 pKa = 10.73GNTCVDD499 pKa = 3.71RR500 pKa = 11.84AVEE503 pKa = 4.54DD504 pKa = 3.87YY505 pKa = 11.05LVDD508 pKa = 3.52GTVPQDD514 pKa = 3.54GLSCC518 pKa = 4.38
MM1 pKa = 6.61NTLRR5 pKa = 11.84RR6 pKa = 11.84ALTVVAALAVASLTLSGCLYY26 pKa = 10.79AAIPPEE32 pKa = 4.47TSATPAPSRR41 pKa = 11.84EE42 pKa = 4.0PDD44 pKa = 3.59LDD46 pKa = 3.66GAPAGFEE53 pKa = 3.89EE54 pKa = 6.39FYY56 pKa = 11.11GQTLSWTPCSGSDD69 pKa = 3.72AGSYY73 pKa = 10.96DD74 pKa = 3.99CTDD77 pKa = 2.82VAAPLDD83 pKa = 3.76WSDD86 pKa = 3.68PASGTIEE93 pKa = 3.81LAVIRR98 pKa = 11.84RR99 pKa = 11.84AATSGDD105 pKa = 3.46ALGSLLTNPGGPGASGYY122 pKa = 11.21DD123 pKa = 3.53LVADD127 pKa = 3.77SASFAVSEE135 pKa = 4.5PVLDD139 pKa = 4.62AYY141 pKa = 10.66DD142 pKa = 3.77VIGFDD147 pKa = 3.45PRR149 pKa = 11.84GVGRR153 pKa = 11.84STAVACLDD161 pKa = 3.68AAGMDD166 pKa = 3.32HH167 pKa = 6.78MLYY170 pKa = 10.34DD171 pKa = 3.93IPADD175 pKa = 3.6PRR177 pKa = 11.84GSQGWTDD184 pKa = 3.76EE185 pKa = 3.93LTQRR189 pKa = 11.84NTEE192 pKa = 3.94FVEE195 pKa = 4.35ACEE198 pKa = 4.23ANSAGILPFVTTDD211 pKa = 2.84NAARR215 pKa = 11.84DD216 pKa = 3.92MDD218 pKa = 4.55LLRR221 pKa = 11.84AVLGDD226 pKa = 3.2KK227 pKa = 9.37TLNYY231 pKa = 10.2LGYY234 pKa = 10.53SYY236 pKa = 10.59GTFLGATYY244 pKa = 10.93AKK246 pKa = 10.27LFPEE250 pKa = 4.08RR251 pKa = 11.84VGRR254 pKa = 11.84LVLDD258 pKa = 4.15GAIDD262 pKa = 4.02PSASGLDD269 pKa = 3.35VGTTQAIGFEE279 pKa = 4.41SALRR283 pKa = 11.84AYY285 pKa = 9.48MADD288 pKa = 3.54CLDD291 pKa = 3.67GRR293 pKa = 11.84GCPFTGTVDD302 pKa = 3.33QAMADD307 pKa = 3.86LGTLLASVDD316 pKa = 4.04AQPLPADD323 pKa = 4.33DD324 pKa = 4.74GRR326 pKa = 11.84MLGADD331 pKa = 3.45TLMTGIIAALYY342 pKa = 10.83AEE344 pKa = 5.31DD345 pKa = 3.39SWPYY349 pKa = 8.98LTQALSQALQGDD361 pKa = 4.23PTTALLLADD370 pKa = 5.19FYY372 pKa = 11.65NGRR375 pKa = 11.84NSDD378 pKa = 2.92GTYY381 pKa = 10.34QDD383 pKa = 3.48NSTEE387 pKa = 3.7AFRR390 pKa = 11.84AYY392 pKa = 11.17NCMDD396 pKa = 3.63YY397 pKa = 11.03PLDD400 pKa = 3.9TSQADD405 pKa = 3.28QDD407 pKa = 3.83AANALIAQKK416 pKa = 10.8APTIAPYY423 pKa = 8.53WQGVDD428 pKa = 3.44VCEE431 pKa = 4.11VWPYY435 pKa = 10.35PPTGVRR441 pKa = 11.84EE442 pKa = 4.28RR443 pKa = 11.84IAADD447 pKa = 3.63GAAPIVVVGTTNDD460 pKa = 3.63PATPYY465 pKa = 10.25AWSVSLAEE473 pKa = 4.11QLSSGVLVTRR483 pKa = 11.84EE484 pKa = 4.46GEE486 pKa = 4.08GHH488 pKa = 5.7TGYY491 pKa = 11.19NKK493 pKa = 10.73GNTCVDD499 pKa = 3.71RR500 pKa = 11.84AVEE503 pKa = 4.54DD504 pKa = 3.87YY505 pKa = 11.05LVDD508 pKa = 3.52GTVPQDD514 pKa = 3.54GLSCC518 pKa = 4.38
Molecular weight: 54.17 kDa
Isoelectric point according different methods:
Protein with the highest isoelectric point:
>tr|A0A543KRX0|A0A543KRX0_9MICO Phosphoglycolate phosphatase OS=Microbacterium lacticum OX=33885 GN=FHX68_1824 PE=4 SV=1
MM1 pKa = 7.4GSVIKK6 pKa = 10.42KK7 pKa = 8.47RR8 pKa = 11.84RR9 pKa = 11.84KK10 pKa = 9.22RR11 pKa = 11.84MAKK14 pKa = 9.41KK15 pKa = 9.87KK16 pKa = 9.7HH17 pKa = 5.84RR18 pKa = 11.84KK19 pKa = 8.56LLRR22 pKa = 11.84KK23 pKa = 7.78TRR25 pKa = 11.84HH26 pKa = 3.65QRR28 pKa = 11.84RR29 pKa = 11.84NKK31 pKa = 9.78KK32 pKa = 9.85
MM1 pKa = 7.4GSVIKK6 pKa = 10.42KK7 pKa = 8.47RR8 pKa = 11.84RR9 pKa = 11.84KK10 pKa = 9.22RR11 pKa = 11.84MAKK14 pKa = 9.41KK15 pKa = 9.87KK16 pKa = 9.7HH17 pKa = 5.84RR18 pKa = 11.84KK19 pKa = 8.56LLRR22 pKa = 11.84KK23 pKa = 7.78TRR25 pKa = 11.84HH26 pKa = 3.65QRR28 pKa = 11.84RR29 pKa = 11.84NKK31 pKa = 9.78KK32 pKa = 9.85
Molecular weight: 4.08 kDa
Isoelectric point according different methods:
Peptides (in silico digests for buttom-up proteomics)
Below you can find in silico digests of the whole proteome with Trypsin, Chymotrypsin, Trypsin+LysC, LysN, ArgC proteases suitable for different mass spec machines.| Try ESI |
 |
|---|
| ChTry ESI |
|
|---|
| ArgC ESI |
|
|---|
| LysN ESI |
|
|---|
| TryLysC ESI |
|
|---|
| Try MALDI |
|
|---|
| ChTry MALDI |
|
|---|
| ArgC MALDI |
|
|---|
| LysN MALDI |
|
|---|
| TryLysC MALDI |
|
|---|
| Try LTQ |
|
|---|
| ChTry LTQ |
|
|---|
| ArgC LTQ |
|
|---|
| LysN LTQ |
|
|---|
| TryLysC LTQ |
|
|---|
| Try MSlow |
|
|---|
| ChTry MSlow |
|
|---|
| ArgC MSlow |
|
|---|
| LysN MSlow |
|
|---|
| TryLysC MSlow |
|
|---|
| Try MShigh |
|
|---|
| ChTry MShigh |
|
|---|
| ArgC MShigh |
|
|---|
| LysN MShigh |
|
|---|
| TryLysC MShigh |
|
|---|
General Statistics
Number of major isoforms |
Number of additional isoforms |
Number of all proteins |
Number of amino acids |
Min. Seq. Length |
Max. Seq. Length |
Avg. Seq. Length |
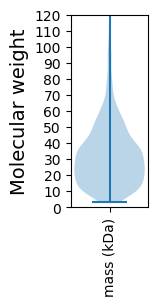
Avg. Mol. Weight |
|---|---|---|---|---|---|---|---|
0 |
875069 |
31 |
2270 |
316.5 |
33.85 |
Amino acid frequency
Ala |
Cys |
Asp |
Glu |
Phe |
Gly |
His |
Ile |
Lys |
Leu |
|---|---|---|---|---|---|---|---|---|---|
14.175 ± 0.076 | 0.501 ± 0.012 |
6.397 ± 0.045 | 5.554 ± 0.052 |
2.954 ± 0.027 | 8.9 ± 0.048 |
2.067 ± 0.024 | 4.407 ± 0.033 |
2.025 ± 0.033 | 9.847 ± 0.051 |
Met |
Asn |
Gln |
Pro |
Arg |
Ser |
Thr |
Val |
Trp |
Tyr |
|---|---|---|---|---|---|---|---|---|---|
1.714 ± 0.018 | 1.824 ± 0.021 |
5.399 ± 0.033 | 2.791 ± 0.028 |
7.713 ± 0.059 | 5.294 ± 0.034 |
6.119 ± 0.044 | 8.839 ± 0.046 |
1.487 ± 0.02 | 1.994 ± 0.023 |
Most of the basic statistics you can see at this page can be downloaded from this CSV file
See this proteome in:

Proteome-pI is available under Creative Commons Attribution-NoDerivs license, for more details see here
| Reference: Kozlowski LP. Proteome-pI 2.0: Proteome Isoelectric Point Database Update. Nucleic Acids Res. 2021, doi: 10.1093/nar/gkab944 | Contact: Lukasz P. Kozlowski |