Mycobacterium phage Jaan
Taxonomy: Viruses; Duplodnaviria; Heunggongvirae; Uroviricota; Caudoviricetes; Caudovirales; Siphoviridae; Fromanvirus; unclassified Fromanvirus
Average proteome isoelectric point is 6.22
Get precalculated fractions of proteins
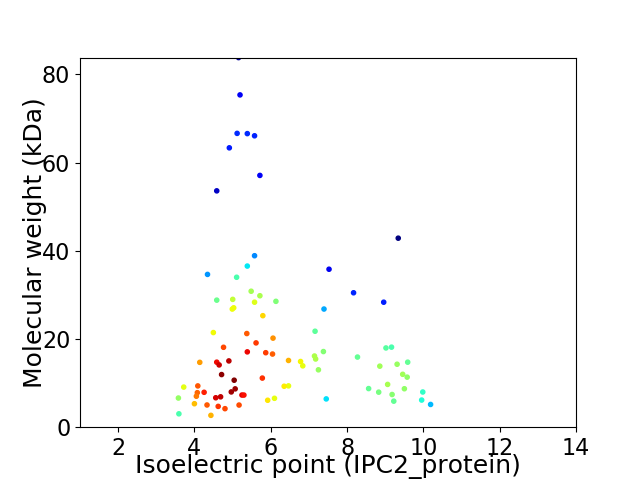
Virtual 2D-PAGE plot for 90 proteins (isoelectric point calculated using IPC2_protein)
Get csv file with sequences according to given criteria:
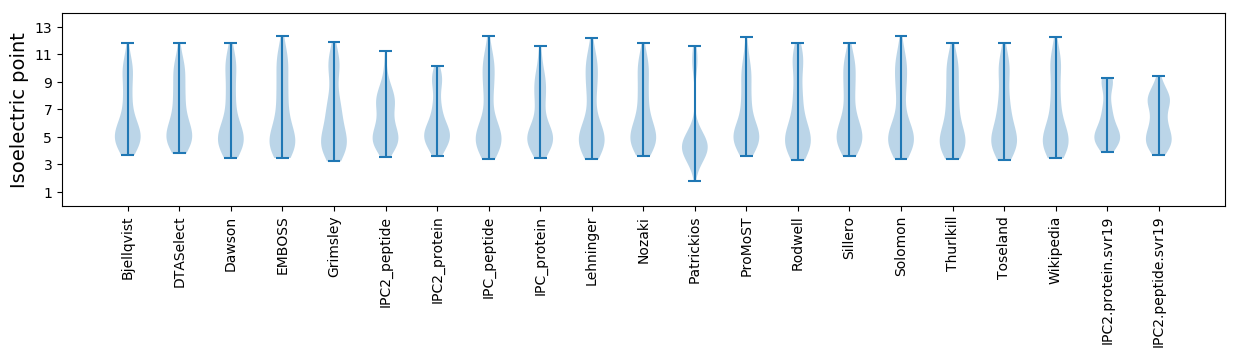
* You can choose from 21 different methods for calculating isoelectric point
Summary statistics related to proteome-wise predictions
Protein with the lowest isoelectric point:
>tr|A0A1J0GNR5|A0A1J0GNR5_9CAUD Esterase OS=Mycobacterium phage Jaan OX=1897439 GN=SEA_JAAN_64 PE=4 SV=1
MM1 pKa = 7.98DD2 pKa = 5.86PEE4 pKa = 4.18QLTLFDD10 pKa = 5.41LEE12 pKa = 5.43DD13 pKa = 3.11IHH15 pKa = 9.15DD16 pKa = 4.26YY17 pKa = 10.63VHH19 pKa = 7.04EE20 pKa = 4.58EE21 pKa = 4.12SDD23 pKa = 4.54DD24 pKa = 3.78EE25 pKa = 4.37
MM1 pKa = 7.98DD2 pKa = 5.86PEE4 pKa = 4.18QLTLFDD10 pKa = 5.41LEE12 pKa = 5.43DD13 pKa = 3.11IHH15 pKa = 9.15DD16 pKa = 4.26YY17 pKa = 10.63VHH19 pKa = 7.04EE20 pKa = 4.58EE21 pKa = 4.12SDD23 pKa = 4.54DD24 pKa = 3.78EE25 pKa = 4.37
Molecular weight: 3.04 kDa
Isoelectric point according different methods:
Protein with the highest isoelectric point:
>tr|A0A1J0GNS5|A0A1J0GNS5_9CAUD Immunity repressor OS=Mycobacterium phage Jaan OX=1897439 GN=SEA_JAAN_74 PE=4 SV=1
MM1 pKa = 7.79PARR4 pKa = 11.84ASIQQTADD12 pKa = 3.35YY13 pKa = 10.31LGVSTKK19 pKa = 7.22TVRR22 pKa = 11.84NYY24 pKa = 9.75IAAGKK29 pKa = 9.64LKK31 pKa = 10.31AVRR34 pKa = 11.84LGPRR38 pKa = 11.84LIRR41 pKa = 11.84VEE43 pKa = 4.05RR44 pKa = 11.84DD45 pKa = 3.15SVEE48 pKa = 3.78ALMRR52 pKa = 11.84PIGNN56 pKa = 3.53
MM1 pKa = 7.79PARR4 pKa = 11.84ASIQQTADD12 pKa = 3.35YY13 pKa = 10.31LGVSTKK19 pKa = 7.22TVRR22 pKa = 11.84NYY24 pKa = 9.75IAAGKK29 pKa = 9.64LKK31 pKa = 10.31AVRR34 pKa = 11.84LGPRR38 pKa = 11.84LIRR41 pKa = 11.84VEE43 pKa = 4.05RR44 pKa = 11.84DD45 pKa = 3.15SVEE48 pKa = 3.78ALMRR52 pKa = 11.84PIGNN56 pKa = 3.53
Molecular weight: 6.15 kDa
Isoelectric point according different methods:
Peptides (in silico digests for buttom-up proteomics)
Below you can find in silico digests of the whole proteome with Trypsin, Chymotrypsin, Trypsin+LysC, LysN, ArgC proteases suitable for different mass spec machines.| Try ESI |
 |
|---|
| ChTry ESI |
|
|---|
| ArgC ESI |
|
|---|
| LysN ESI |
|
|---|
| TryLysC ESI |
|
|---|
| Try MALDI |
|
|---|
| ChTry MALDI |
|
|---|
| ArgC MALDI |
|
|---|
| LysN MALDI |
|
|---|
| TryLysC MALDI |
|
|---|
| Try LTQ |
|
|---|
| ChTry LTQ |
|
|---|
| ArgC LTQ |
|
|---|
| LysN LTQ |
|
|---|
| TryLysC LTQ |
|
|---|
| Try MSlow |
|
|---|
| ChTry MSlow |
|
|---|
| ArgC MSlow |
|
|---|
| LysN MSlow |
|
|---|
| TryLysC MSlow |
|
|---|
| Try MShigh |
|
|---|
| ChTry MShigh |
|
|---|
| ArgC MShigh |
|
|---|
| LysN MShigh |
|
|---|
| TryLysC MShigh |
|
|---|
General Statistics
Number of major isoforms |
Number of additional isoforms |
Number of all proteins |
Number of amino acids |
Min. Seq. Length |
Max. Seq. Length |
Avg. Seq. Length |
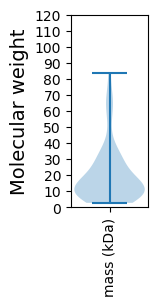
Avg. Mol. Weight |
|---|---|---|---|---|---|---|---|
0 |
16382 |
22 |
792 |
182.0 |
20.13 |
Amino acid frequency
Ala |
Cys |
Asp |
Glu |
Phe |
Gly |
His |
Ile |
Lys |
Leu |
|---|---|---|---|---|---|---|---|---|---|
9.877 ± 0.351 | 0.842 ± 0.119 |
6.324 ± 0.184 | 6.812 ± 0.304 |
3.431 ± 0.178 | 8.723 ± 0.511 |
2.124 ± 0.177 | 5.121 ± 0.245 |
4.877 ± 0.304 | 7.99 ± 0.257 |
Met |
Asn |
Gln |
Pro |
Arg |
Ser |
Thr |
Val |
Trp |
Tyr |
|---|---|---|---|---|---|---|---|---|---|
2.503 ± 0.132 | 3.339 ± 0.168 |
5.653 ± 0.336 | 3.473 ± 0.186 |
6.525 ± 0.387 | 5.073 ± 0.221 |
5.598 ± 0.216 | 6.837 ± 0.228 |
2.039 ± 0.112 | 2.838 ± 0.158 |
Most of the basic statistics you can see at this page can be downloaded from this CSV file
See this proteome in:

Proteome-pI is available under Creative Commons Attribution-NoDerivs license, for more details see here
| Reference: Kozlowski LP. Proteome-pI 2.0: Proteome Isoelectric Point Database Update. Nucleic Acids Res. 2021, doi: 10.1093/nar/gkab944 | Contact: Lukasz P. Kozlowski |