Escherichia phage ECBP5
Taxonomy: Viruses; Duplodnaviria; Heunggongvirae; Uroviricota; Caudoviricetes; Caudovirales; Autographiviridae; Gajwadongvirus; Escherichia virus ECBP5
Average proteome isoelectric point is 6.43
Get precalculated fractions of proteins
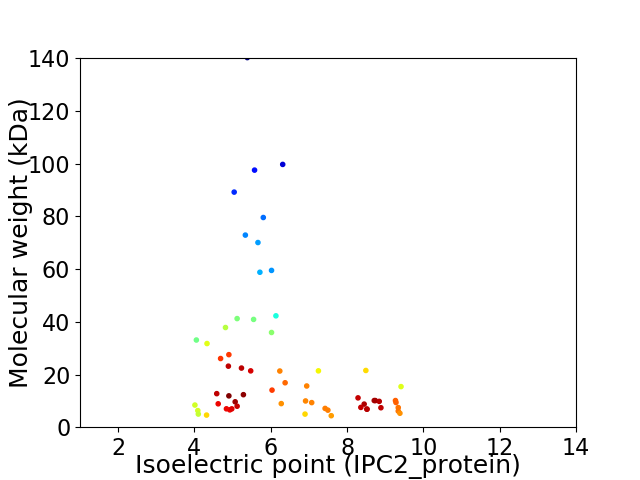
Virtual 2D-PAGE plot for 62 proteins (isoelectric point calculated using IPC2_protein)
Get csv file with sequences according to given criteria:
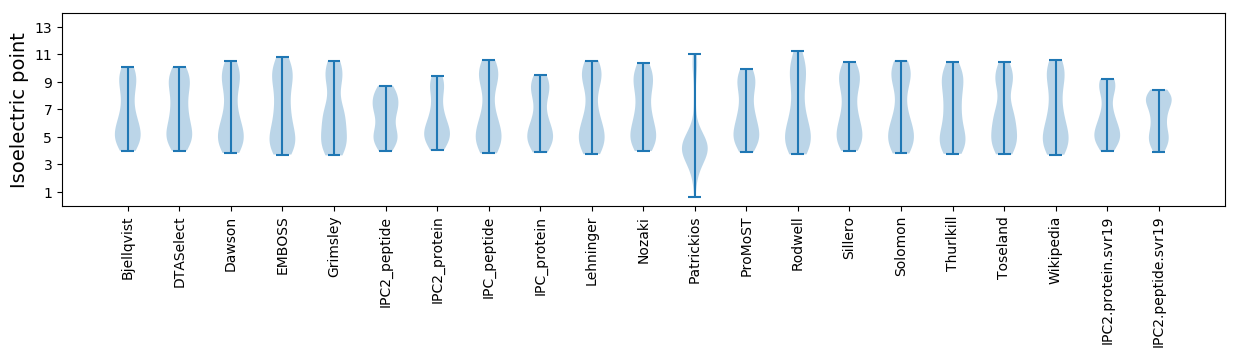
* You can choose from 21 different methods for calculating isoelectric point
Summary statistics related to proteome-wise predictions
Protein with the lowest isoelectric point:
>tr|A0A0F6N5M8|A0A0F6N5M8_9CAUD Uncharacterized protein OS=Escherichia phage ECBP5 OX=1498172 GN=ECBP5_0058 PE=4 SV=1
MM1 pKa = 7.41EE2 pKa = 4.71VSCSSWCQLKK12 pKa = 8.59WQEE15 pKa = 4.15AVEE18 pKa = 4.57SGDD21 pKa = 4.31DD22 pKa = 3.75LAASDD27 pKa = 4.1YY28 pKa = 11.42LKK30 pKa = 10.75LYY32 pKa = 8.42EE33 pKa = 4.26LWSSRR38 pKa = 11.84GMM40 pKa = 3.65
MM1 pKa = 7.41EE2 pKa = 4.71VSCSSWCQLKK12 pKa = 8.59WQEE15 pKa = 4.15AVEE18 pKa = 4.57SGDD21 pKa = 4.31DD22 pKa = 3.75LAASDD27 pKa = 4.1YY28 pKa = 11.42LKK30 pKa = 10.75LYY32 pKa = 8.42EE33 pKa = 4.26LWSSRR38 pKa = 11.84GMM40 pKa = 3.65
Molecular weight: 4.6 kDa
Isoelectric point according different methods:
Protein with the highest isoelectric point:
>tr|A0A0F6N5N0|A0A0F6N5N0_9CAUD Uncharacterized protein OS=Escherichia phage ECBP5 OX=1498172 GN=ECBP5_0003 PE=4 SV=1
MM1 pKa = 7.92SYY3 pKa = 10.15PISYY7 pKa = 9.1QWCSKK12 pKa = 10.26LKK14 pKa = 9.68TVAHH18 pKa = 4.66QTKK21 pKa = 10.36DD22 pKa = 2.52RR23 pKa = 11.84YY24 pKa = 6.93TQQRR28 pKa = 11.84TSTRR32 pKa = 11.84VQQATALSSSQSASSHH48 pKa = 3.79WQANRR53 pKa = 11.84SHH55 pKa = 6.65SGAEE59 pKa = 3.79AHH61 pKa = 6.5SGSLAAHH68 pKa = 5.98NRR70 pKa = 11.84LSVSHH75 pKa = 6.89LASSQQLPDD84 pKa = 3.51QPLVDD89 pKa = 3.58QSVV92 pKa = 2.77
MM1 pKa = 7.92SYY3 pKa = 10.15PISYY7 pKa = 9.1QWCSKK12 pKa = 10.26LKK14 pKa = 9.68TVAHH18 pKa = 4.66QTKK21 pKa = 10.36DD22 pKa = 2.52RR23 pKa = 11.84YY24 pKa = 6.93TQQRR28 pKa = 11.84TSTRR32 pKa = 11.84VQQATALSSSQSASSHH48 pKa = 3.79WQANRR53 pKa = 11.84SHH55 pKa = 6.65SGAEE59 pKa = 3.79AHH61 pKa = 6.5SGSLAAHH68 pKa = 5.98NRR70 pKa = 11.84LSVSHH75 pKa = 6.89LASSQQLPDD84 pKa = 3.51QPLVDD89 pKa = 3.58QSVV92 pKa = 2.77
Molecular weight: 10.12 kDa
Isoelectric point according different methods:
Peptides (in silico digests for buttom-up proteomics)
Below you can find in silico digests of the whole proteome with Trypsin, Chymotrypsin, Trypsin+LysC, LysN, ArgC proteases suitable for different mass spec machines.| Try ESI |
 |
|---|
| ChTry ESI |
|
|---|
| ArgC ESI |
|
|---|
| LysN ESI |
|
|---|
| TryLysC ESI |
|
|---|
| Try MALDI |
|
|---|
| ChTry MALDI |
|
|---|
| ArgC MALDI |
|
|---|
| LysN MALDI |
|
|---|
| TryLysC MALDI |
|
|---|
| Try LTQ |
|
|---|
| ChTry LTQ |
|
|---|
| ArgC LTQ |
|
|---|
| LysN LTQ |
|
|---|
| TryLysC LTQ |
|
|---|
| Try MSlow |
|
|---|
| ChTry MSlow |
|
|---|
| ArgC MSlow |
|
|---|
| LysN MSlow |
|
|---|
| TryLysC MSlow |
|
|---|
| Try MShigh |
|
|---|
| ChTry MShigh |
|
|---|
| ArgC MShigh |
|
|---|
| LysN MShigh |
|
|---|
| TryLysC MShigh |
|
|---|
General Statistics
Number of major isoforms |
Number of additional isoforms |
Number of all proteins |
Number of amino acids |
Min. Seq. Length |
Max. Seq. Length |
Avg. Seq. Length |
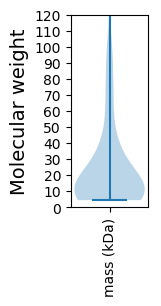
Avg. Mol. Weight |
|---|---|---|---|---|---|---|---|
0 |
13919 |
38 |
1287 |
224.5 |
25.07 |
Amino acid frequency
Ala |
Cys |
Asp |
Glu |
Phe |
Gly |
His |
Ile |
Lys |
Leu |
|---|---|---|---|---|---|---|---|---|---|
8.923 ± 0.423 | 1.07 ± 0.143 |
6.25 ± 0.245 | 6.617 ± 0.352 |
3.829 ± 0.191 | 7.091 ± 0.262 |
1.94 ± 0.19 | 4.893 ± 0.203 |
6.61 ± 0.282 | 8.391 ± 0.272 |
Met |
Asn |
Gln |
Pro |
Arg |
Ser |
Thr |
Val |
Trp |
Tyr |
|---|---|---|---|---|---|---|---|---|---|
3.125 ± 0.169 | 4.347 ± 0.276 |
3.657 ± 0.166 | 4.684 ± 0.31 |
4.612 ± 0.219 | 6.071 ± 0.3 |
5.862 ± 0.257 | 6.875 ± 0.302 |
1.394 ± 0.128 | 3.757 ± 0.204 |
Most of the basic statistics you can see at this page can be downloaded from this CSV file
See this proteome in:

Proteome-pI is available under Creative Commons Attribution-NoDerivs license, for more details see here
| Reference: Kozlowski LP. Proteome-pI 2.0: Proteome Isoelectric Point Database Update. Nucleic Acids Res. 2021, doi: 10.1093/nar/gkab944 | Contact: Lukasz P. Kozlowski |