Actinomadura sp. NEAU-G17
Taxonomy: cellular organisms; Bacteria; Terrabacteria group; Actinobacteria; Actinomycetia; Streptosporangiales; Thermomonosporaceae; Actinomadura
Average proteome isoelectric point is 6.69
Get precalculated fractions of proteins
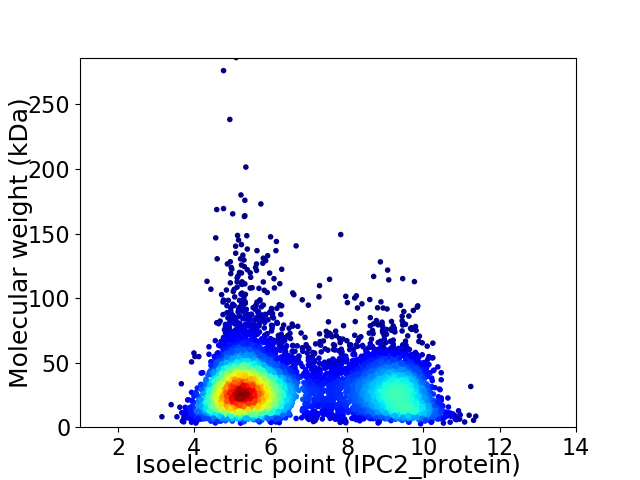
Virtual 2D-PAGE plot for 7310 proteins (isoelectric point calculated using IPC2_protein)
Get csv file with sequences according to given criteria:
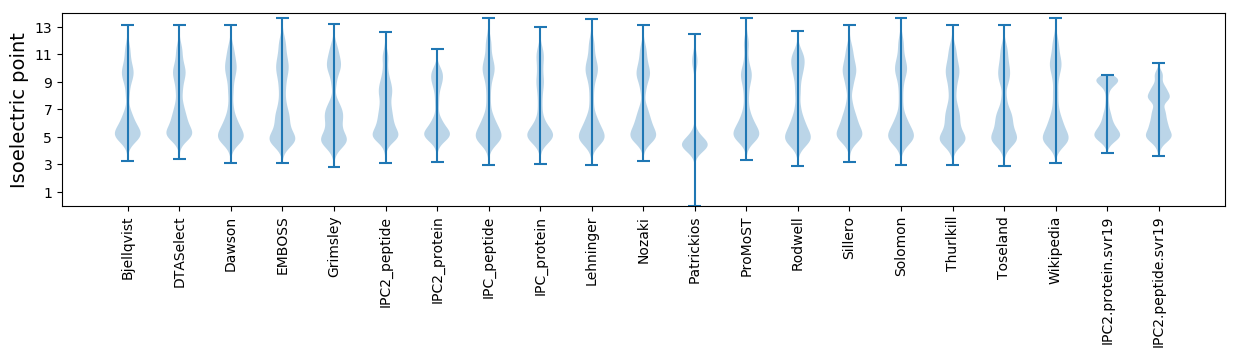
* You can choose from 21 different methods for calculating isoelectric point
Summary statistics related to proteome-wise predictions
Protein with the lowest isoelectric point:
>tr|A0A372JMN8|A0A372JMN8_9ACTN TetR/AcrR family transcriptional regulator OS=Actinomadura sp. NEAU-G17 OX=2293572 GN=DZF91_13145 PE=4 SV=1
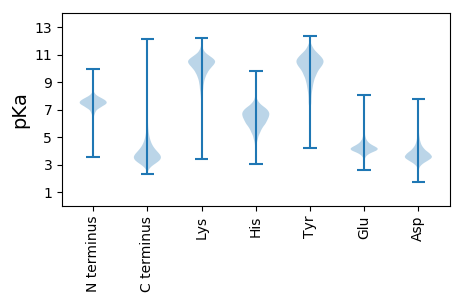
MM1 pKa = 7.81DD2 pKa = 3.99TTEE5 pKa = 5.1HH6 pKa = 7.67DD7 pKa = 3.75YY8 pKa = 11.3QLDD11 pKa = 3.57VRR13 pKa = 11.84LVDD16 pKa = 4.54AGPAASGHH24 pKa = 5.63ATNTDD29 pKa = 3.69DD30 pKa = 4.85GCGSGNTGSNACTGGRR46 pKa = 11.84DD47 pKa = 3.21
MM1 pKa = 7.81DD2 pKa = 3.99TTEE5 pKa = 5.1HH6 pKa = 7.67DD7 pKa = 3.75YY8 pKa = 11.3QLDD11 pKa = 3.57VRR13 pKa = 11.84LVDD16 pKa = 4.54AGPAASGHH24 pKa = 5.63ATNTDD29 pKa = 3.69DD30 pKa = 4.85GCGSGNTGSNACTGGRR46 pKa = 11.84DD47 pKa = 3.21
Molecular weight: 4.71 kDa
Isoelectric point according different methods:
Protein with the highest isoelectric point:
>tr|A0A372JN11|A0A372JN11_9ACTN ADP-ribosylglycohydrolase family protein OS=Actinomadura sp. NEAU-G17 OX=2293572 GN=DZF91_15570 PE=4 SV=1
MM1 pKa = 7.69SKK3 pKa = 9.0RR4 pKa = 11.84TFQPNNRR11 pKa = 11.84RR12 pKa = 11.84RR13 pKa = 11.84HH14 pKa = 5.34KK15 pKa = 10.47KK16 pKa = 8.84HH17 pKa = 5.5GFRR20 pKa = 11.84LRR22 pKa = 11.84MRR24 pKa = 11.84TRR26 pKa = 11.84AGRR29 pKa = 11.84AVLSSRR35 pKa = 11.84RR36 pKa = 11.84GKK38 pKa = 10.07GRR40 pKa = 11.84ARR42 pKa = 11.84IAVV45 pKa = 3.5
MM1 pKa = 7.69SKK3 pKa = 9.0RR4 pKa = 11.84TFQPNNRR11 pKa = 11.84RR12 pKa = 11.84RR13 pKa = 11.84HH14 pKa = 5.34KK15 pKa = 10.47KK16 pKa = 8.84HH17 pKa = 5.5GFRR20 pKa = 11.84LRR22 pKa = 11.84MRR24 pKa = 11.84TRR26 pKa = 11.84AGRR29 pKa = 11.84AVLSSRR35 pKa = 11.84RR36 pKa = 11.84GKK38 pKa = 10.07GRR40 pKa = 11.84ARR42 pKa = 11.84IAVV45 pKa = 3.5
Molecular weight: 5.36 kDa
Isoelectric point according different methods:
Peptides (in silico digests for buttom-up proteomics)
Below you can find in silico digests of the whole proteome with Trypsin, Chymotrypsin, Trypsin+LysC, LysN, ArgC proteases suitable for different mass spec machines.| Try ESI |
 |
|---|
| ChTry ESI |
|
|---|
| ArgC ESI |
|
|---|
| LysN ESI |
|
|---|
| TryLysC ESI |
|
|---|
| Try MALDI |
|
|---|
| ChTry MALDI |
|
|---|
| ArgC MALDI |
|
|---|
| LysN MALDI |
|
|---|
| TryLysC MALDI |
|
|---|
| Try LTQ |
|
|---|
| ChTry LTQ |
|
|---|
| ArgC LTQ |
|
|---|
| LysN LTQ |
|
|---|
| TryLysC LTQ |
|
|---|
| Try MSlow |
|
|---|
| ChTry MSlow |
|
|---|
| ArgC MSlow |
|
|---|
| LysN MSlow |
|
|---|
| TryLysC MSlow |
|
|---|
| Try MShigh |
|
|---|
| ChTry MShigh |
|
|---|
| ArgC MShigh |
|
|---|
| LysN MShigh |
|
|---|
| TryLysC MShigh |
|
|---|
General Statistics
Number of major isoforms |
Number of additional isoforms |
Number of all proteins |
Number of amino acids |
Min. Seq. Length |
Max. Seq. Length |
Avg. Seq. Length |
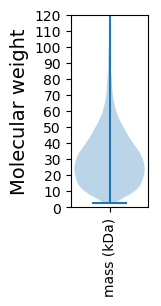
Avg. Mol. Weight |
|---|---|---|---|---|---|---|---|
0 |
2210062 |
29 |
2725 |
302.3 |
32.34 |
Amino acid frequency
Ala |
Cys |
Asp |
Glu |
Phe |
Gly |
His |
Ile |
Lys |
Leu |
|---|---|---|---|---|---|---|---|---|---|
13.927 ± 0.044 | 0.758 ± 0.007 |
6.085 ± 0.024 | 5.49 ± 0.031 |
2.795 ± 0.017 | 9.684 ± 0.031 |
2.222 ± 0.012 | 2.993 ± 0.018 |
1.874 ± 0.021 | 10.363 ± 0.036 |
Met |
Asn |
Gln |
Pro |
Arg |
Ser |
Thr |
Val |
Trp |
Tyr |
|---|---|---|---|---|---|---|---|---|---|
1.805 ± 0.012 | 1.651 ± 0.014 |
6.425 ± 0.029 | 2.348 ± 0.017 |
8.802 ± 0.031 | 4.789 ± 0.023 |
5.731 ± 0.021 | 8.796 ± 0.033 |
1.501 ± 0.012 | 1.96 ± 0.015 |
Most of the basic statistics you can see at this page can be downloaded from this CSV file
See this proteome in:

Proteome-pI is available under Creative Commons Attribution-NoDerivs license, for more details see here
| Reference: Kozlowski LP. Proteome-pI 2.0: Proteome Isoelectric Point Database Update. Nucleic Acids Res. 2021, doi: 10.1093/nar/gkab944 | Contact: Lukasz P. Kozlowski |